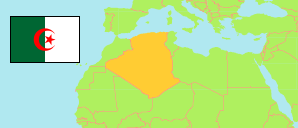
El Oued
Province in Algeria
Contents: Subdivision
The population development in El Oued as well as related information and services (Wikipedia, Google, images).
| Name | Status | Native | Population Census 1998-06-25 | Population Census 2008-04-14 | |
|---|---|---|---|---|---|
| El Oued | Province | الواد | 504,401 | 647,548 | |
| Bayadha | Commune | البياضة | 26,535 | 32,926 | → |
| Beni Guecha | Commune | بن قشة | 1,036 | 2,513 | → |
| Debila | Commune | الدبيلة | 20,088 | 25,158 | → |
| Djamaa | Commune | جامعة | 37,438 | 50,916 | → |
| Douar El Ma | Commune | دوار الماء | 3,527 | 5,543 | → |
| El M'Ghair | Commune | المغير | 40,228 | 49,793 | → |
| El Ogla | Commune | العقلة | 4,715 | 6,102 | → |
| El Oued | Province Capital | الوادى | 105,256 | 134,699 | → |
| Guemar | Commune | قمار | 29,185 | 39,168 | → |
| Hamraia | Commune | حمراية | 3,938 | 5,172 | → |
| Hassani Abdelkrim | Commune | حسينى عبد الكريم | 17,207 | 22,755 | → |
| Hassi Khalifa | Commune | حاسى خليفة | 25,118 | 31,784 | → |
| Kouinine | Commune | كوينين | 7,571 | 10,076 | → |
| Magrane | Commune | مقرن | 20,102 | 24,577 | → |
| Mih Ouansa | Commune | مية ونسة | 11,779 | 15,593 | → |
| M'Rara | Commune | مرارة | 5,976 | 7,999 | → |
| Nakhla | Commune | النخلة | 9,491 | 12,652 | → |
| Oued El Alenda | Commune | وادى العلندة | 5,839 | 6,830 | → |
| Oum Touyour | Commune | أم الطيور | 9,735 | 11,069 | → |
| Ourmas | Commune | أرماس | 5,059 | 5,900 | → |
| Reguiba | Commune | الرقيبة | 30,392 | 40,367 | → |
| Robbah | Commune | رباح | 17,243 | 21,965 | → |
| Sidi Amrane | Commune | سيدي عمران | 18,732 | 21,772 | → |
| Sidi Aoun | Commune | سيدي عون | 10,018 | 12,235 | → |
| Sidi Khellil | Commune | سيدي خليل | 5,524 | 6,547 | → |
| Still | Commune | سطيل | 3,545 | 4,978 | → |
| Taghzout | Commune | تاغزوت | 11,147 | 13,934 | → |
| Taleb Larbi | Commune | طالب العربي | 3,582 | 7,074 | → |
| Tendla | Commune | تندلة | 8,033 | 9,193 | → |
| Trifaoui | Commune | تريفاوى | 6,361 | 8,257 | → |
| Algérie [Algeria] | Republic | الجزائر | 29,100,867 | 34,080,030 |
Source: Office National des Statistiques de l'Algérie (web).
Further information about the population structure:
| Gender (C 2008) | |
|---|---|
| Males | 329,604 |
| Females | 317,944 |
| Age Groups (C 2008) | |
|---|---|
| 0-14 years | 236,075 |
| 15-64 years | 383,583 |
| 65+ years | 26,639 |
| Age Distribution (C 2008) | |
|---|---|
| 0-9 years | 158,846 |
| 10-19 years | 157,753 |
| 20-29 years | 132,807 |
| 30-39 years | 75,862 |
| 40-49 years | 53,206 |
| 50-59 years | 31,353 |
| 60-69 years | 18,870 |
| 70-79 years | 12,558 |
| 80+ years | 5,042 |
| Clustering (C 2008) | |
|---|---|
| in main locality | 495,573 |
| in other settlements | 124,890 |
| scattered | 27,084 |