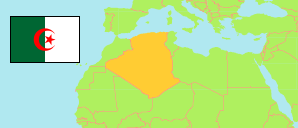
El Tarf
Province in Algeria
Contents: Subdivision
The population development in El Tarf as well as related information and services (Wikipedia, Google, images).
| Name | Status | Native | Population Census 1998-06-25 | Population Census 2008-04-14 | |
|---|---|---|---|---|---|
| El Tarf | Province | الطارف | 352,588 | 408,414 | |
| Aïn El Assel | Commune | عين العسل | 12,482 | 16,285 | → |
| Aïn Kerma | Commune | عين الكرمة | 12,182 | 14,377 | → |
| Asfour | Commune | عصفور | 10,632 | 11,447 | → |
| Ben Mehidi | Commune | بن مهيدى | 28,399 | 33,262 | → |
| Berrihane | Commune | برحان | 8,326 | 9,605 | → |
| Besbes | Commune | البسباس | 43,007 | 46,341 | → |
| Bougous | Commune | بوقوس | 10,576 | 11,234 | → |
| Bouhadjar | Commune | بوحجار | 16,385 | 20,215 | → |
| Bouteldja | Commune | بوثلجة | 15,275 | 17,738 | → |
| Chebaita Mokhtar | Commune | شبايطة مختار | 20,913 | 23,135 | → |
| Chefia | Commune | الشافية | 7,450 | 8,195 | → |
| Chihani | Commune | شهانى | 9,234 | 10,094 | → |
| Dréan | Commune | الذرعان | 32,066 | 37,686 | → |
| Echatt | Commune | الشط | 26,758 | 34,378 | → |
| El Aïoun | Commune | العيون | 4,591 | 5,347 | → |
| El Kala | Commune | القالة | 24,793 | 28,411 | → |
| El Tarf | Province Capital | الطارف | 20,362 | 25,594 | → |
| Hammam Beni Salah | Commune | حمام بنى صالح | 4,871 | 5,235 | → |
| Lac des Oiseaux | Commune | بحيرة الطيور | 9,320 | 10,624 | → |
| Oued Zitoun | Commune | وادى الزيتون | 5,321 | 5,881 | → |
| Raml Souk | Commune | رمل سوق | 3,715 | 4,356 | → |
| Souarekh | Commune | السوارخ | 7,457 | 8,173 | → |
| Zerizer | Commune | زريزر | 10,105 | 11,064 | → |
| Zitouna | Commune | الزيتونة | 8,367 | 9,736 | → |
| Algérie [Algeria] | Republic | الجزائر | 29,100,867 | 34,080,030 |
Source: Office National des Statistiques de l'Algérie (web).
Further information about the population structure:
| Gender (C 2008) | |
|---|---|
| Males | 203,933 |
| Females | 204,480 |
| Age Groups (C 2008) | |
|---|---|
| 0-14 years | 102,445 |
| 15-64 years | 283,400 |
| 65+ years | 22,462 |
| Age Distribution (C 2008) | |
|---|---|
| 0-9 years | 66,649 |
| 10-19 years | 75,833 |
| 20-29 years | 86,271 |
| 30-39 years | 67,258 |
| 40-49 years | 48,721 |
| 50-59 years | 31,303 |
| 60-69 years | 17,521 |
| 70-79 years | 10,773 |
| 80+ years | 3,978 |
| Clustering (C 2008) | |
|---|---|
| in main locality | 230,156 |
| in other settlements | 122,433 |
| scattered | 55,824 |