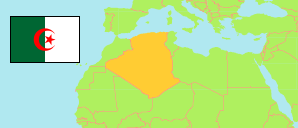
El Bayadh
Province in Algeria
Contents: Subdivision
The population development in El Bayadh as well as related information and services (Wikipedia, Google, images).
| Name | Status | Native | Population Census 1998-06-25 | Population Census 2008-04-14 | |
|---|---|---|---|---|---|
| El Bayadh | Province | البيض | 168,789 | 228,624 | |
| Aïn El Orak | Commune | عين العراك | 1,990 | 1,424 | → |
| Arbaouat | Commune | عرباوة | 3,252 | 4,321 | → |
| Boualem | Commune | بوعلام | 5,386 | 7,578 | → |
| Bougtoub | Commune | بوقطب | 13,605 | 18,568 | → |
| Boussemghoun | Commune | بوسمغون | 2,480 | 3,795 | → |
| Brezina | Commune | بريزينة | 8,536 | 12,468 | → |
| Cheguig | Commune | الشقيق | 1,693 | 3,282 | → |
| Chellala | Commune | شلالة | 3,745 | 3,929 | → |
| El Abiodh Sidi Cheikh | Commune | الابيض سيدي الشيخ | 20,675 | 24,949 | → |
| El Bayadh | Province Capital | البيض | 64,632 | 91,632 | → |
| El Bnoud | Commune | البنود | 1,195 | 1,607 | → |
| El Kheiter | Commune | الخيثر | 7,614 | 6,949 | → |
| El Mehara | Commune | المهارة | 2,138 | 3,252 | → |
| Ghassoul | Commune | غسول | 5,179 | 7,880 | → |
| Kef El Ahmar | Commune | الكاف الاحمر | 5,245 | 7,566 | → |
| Kraakda | Commune | كراكدة | 2,103 | 1,750 | → |
| Rogassa | Commune | روقاصة | 5,598 | 7,492 | → |
| Sidi Ameur | Commune | سيدي عامر | 2,685 | 3,634 | → |
| Sidi Slimane | Commune | سيدي سليمان | 1,563 | 1,806 | → |
| Sidi Tifour | Commune | سيدي طيفور | 2,930 | 5,565 | → |
| Stitten | Commune | ستيتين | 4,495 | 6,022 | → |
| Tousmouline | Commune | توسمولين | 2,050 | 3,155 | → |
| Algérie [Algeria] | Republic | الجزائر | 29,100,867 | 34,080,030 |
Source: Office National des Statistiques de l'Algérie (web).
Further information about the population structure:
| Gender (C 2008) | |
|---|---|
| Males | 115,449 |
| Females | 113,175 |
| Age Groups (C 2008) | |
|---|---|
| 0-14 years | 74,212 |
| 15-64 years | 142,246 |
| 65+ years | 11,882 |
| Age Distribution (C 2008) | |
|---|---|
| 0-9 years | 49,858 |
| 10-19 years | 48,149 |
| 20-29 years | 45,536 |
| 30-39 years | 33,808 |
| 40-49 years | 21,628 |
| 50-59 years | 13,674 |
| 60-69 years | 7,685 |
| 70-79 years | 5,274 |
| 80+ years | 2,728 |
| Clustering (C 2008) | |
|---|---|
| in main locality | 192,959 |
| in other settlements | 10,302 |
| scattered | 25,363 |