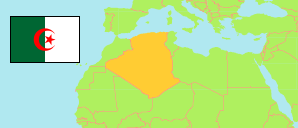
Ouargla
Province in Algeria
Contents: Subdivision
The population development in Ouargla as well as related information and services (Wikipedia, Google, images).
| Name | Status | Native | Population Census 1998-06-25 | Population Census 2008-04-14 | |
|---|---|---|---|---|---|
| Ouargla | Province | ورقلة | 445,619 | 558,558 | |
| Aïn Beida | Commune | عين البيضاء | 14,500 | 19,039 | → |
| Benaceur | Commune | بن ناصر | 7,808 | 10,330 | → |
| Blidet Amor | Commune | بليدة عامر | 12,135 | 14,540 | → |
| El Allia | Commune | العالية | 6,530 | 7,509 | → |
| El Borma | Commune | البرمة | 1,997 | 3,205 | → |
| El Hadjira | Commune | الحجيرة | 12,781 | 14,965 | → |
| Hassi Ben Abdellah | Commune | حاسي بن عبد الله | 3,693 | 4,950 | → |
| Hassi Messaoud | Commune | حاسى مسعود | 40,368 | 45,147 | → |
| Megarine | Commune | المقارين | 10,996 | 13,751 | → |
| M'Naguer | Commune | المنقر | 11,243 | 14,179 | → |
| Nezla | Commune | نزلة | 40,524 | 51,674 | → |
| N'Goussa | Commune | نقوسة | 13,344 | 16,581 | → |
| Ouargla | Province Capital | ورقلة | 112,339 | 133,024 | → |
| Rouissat | Commune | الرويسات | 37,814 | 58,112 | → |
| Sidi Khouiled | Commune | سيدي خويلد | 4,309 | 8,803 | → |
| Sidi Slimane | Commune | سيدي سليمان | 6,822 | 8,072 | → |
| Taibet | Commune | الطيبات | 14,322 | 20,174 | → |
| Tamacine | Commune | تماسين | 15,933 | 20,067 | → |
| Tebesbest | Commune | تيبسبست | 29,840 | 35,032 | → |
| Touggourt | Commune | توقرت | 32,940 | 39,409 | → |
| Zaouia El Abidia | Commune | الزاوية العابدية | 15,381 | 19,993 | → |
| Algérie [Algeria] | Republic | الجزائر | 29,100,867 | 34,080,030 |
Source: Office National des Statistiques de l'Algérie (web).
Further information about the population structure:
| Gender (C 2008) | |
|---|---|
| Males | 283,389 |
| Females | 275,169 |
| Age Groups (C 2008) | |
|---|---|
| 0-14 years | 192,765 |
| 15-64 years | 344,860 |
| 65+ years | 19,972 |
| Age Distribution (C 2008) | |
|---|---|
| 0-9 years | 128,424 |
| 10-19 years | 130,654 |
| 20-29 years | 117,636 |
| 30-39 years | 72,349 |
| 40-49 years | 50,996 |
| 50-59 years | 29,072 |
| 60-69 years | 15,540 |
| 70-79 years | 9,184 |
| 80+ years | 3,742 |
| Clustering (C 2008) | |
|---|---|
| in main locality | 473,543 |
| in other settlements | 68,983 |
| scattered | 16,030 |
