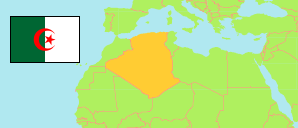
Mostaganem
Province in Algeria
Contents: Subdivision
The population development in Mostaganem as well as related information and services (Wikipedia, Google, images).
| Name | Status | Native | Population Census 1998-06-25 | Population Census 2008-04-14 | |
|---|---|---|---|---|---|
| Mostaganem | Province | مستغانم | 631,057 | 737,118 | |
| Abdelmalek Ramdane | Commune | عبد المالك رمضان | 12,577 | 13,607 | → |
| Achaacha | Commune | عشعاشة | 31,360 | 34,789 | → |
| Aïn Boudinar | Commune | عين بودينار | 5,241 | 6,060 | → |
| Aïn Nouïssy | Commune | عين نويسى | 11,389 | 14,530 | → |
| Aïn Sidi Cherif | Commune | عين سيدي الشريف | 7,819 | 9,748 | → |
| Aïn Tedles | Commune | عين تادلس | 31,685 | 38,823 | → |
| Bouguirat | Commune | بوقيراط | 26,954 | 31,469 | → |
| El Hassaine | Commune | الحسيان | 8,835 | 9,680 | → |
| Fornaka | Commune | فرناكة | 14,371 | 16,543 | → |
| Hadjadj | Commune | حجاج | 15,835 | 17,330 | → |
| Hassi Mameche | Commune | حاسى معاش | 21,778 | 28,790 | → |
| Khadra | Commune | خضراء | 12,294 | 14,045 | → |
| Kheireddine | Commune | خير الدين | 22,241 | 27,606 | → |
| Mansourah | Commune | منصورة | 15,641 | 18,216 | → |
| Mazagran | Commune | مزغران | 15,120 | 22,016 | → |
| Mesra | Commune | ماسرة | 20,053 | 25,196 | → |
| Mostaganem | Province Capital | مستغانم | 130,288 | 145,696 | → |
| Nekmaria | Commune | نقمارية | 9,104 | 10,446 | → |
| Oued El Kheir | Commune | وادى الخير | 14,700 | 17,359 | → |
| Ouled Boughalem | Commune | أولاد بوغالم | 11,886 | 13,761 | → |
| Ouled Maallah | Commune | أولاد مع الله | 8,948 | 9,576 | → |
| Safsaf | Commune | صفصاف | 12,492 | 13,980 | → |
| Sayada | Commune | صيادة | 21,900 | 28,675 | → |
| Sidi Ali | Commune | سيدي على | 31,840 | 37,230 | → |
| Sidi Belattar | Commune | سيدي بلعاتر | 6,670 | 6,794 | → |
| Sidi Lakhdar | Commune | سيدي لخضر | 30,950 | 34,612 | → |
| Sirat | Commune | سيرات | 17,979 | 21,677 | → |
| Souaflia | Commune | السوافلية | 14,356 | 17,223 | → |
| Sour | Commune | صور | 20,625 | 22,673 | → |
| Stidia | Commune | ستيدية | 10,688 | 11,965 | → |
| Tazgait | Commune | تزقايت | 8,763 | 9,410 | → |
| Touahria | Commune | الطواهيرية | 6,674 | 7,593 | → |
| Algérie [Algeria] | Republic | الجزائر | 29,100,867 | 34,080,030 |
Source: Office National des Statistiques de l'Algérie (web).
Further information about the population structure:
| Gender (C 2008) | |
|---|---|
| Males | 370,018 |
| Females | 367,100 |
| Age Groups (C 2008) | |
|---|---|
| 0-14 years | 205,290 |
| 15-64 years | 496,064 |
| 65+ years | 35,492 |
| Age Distribution (C 2008) | |
|---|---|
| 0-9 years | 135,169 |
| 10-19 years | 149,285 |
| 20-29 years | 163,098 |
| 30-39 years | 108,606 |
| 40-49 years | 78,382 |
| 50-59 years | 51,568 |
| 60-69 years | 28,523 |
| 70-79 years | 17,235 |
| 80+ years | 4,980 |
| Clustering (C 2008) | |
|---|---|
| in main locality | 338,141 |
| in other settlements | 98,393 |
| scattered | 300,584 |
