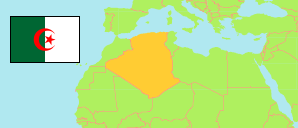
Tébessa
Province in Algeria
Contents: Subdivision
The population development in Tébessa as well as related information and services (Wikipedia, Google, images).
| Name | Status | Native | Population Census 1998-06-25 | Population Census 2008-04-14 | |
|---|---|---|---|---|---|
| Tébessa | Province | تبسة | 549,066 | 648,703 | |
| Aïn Zerga | Commune | عين الزرقاء | 18,998 | 20,170 | → |
| Bedjene | Commune | بجن | 3,685 | 4,505 | → |
| Bekkaria | Commune | بكارية | 7,551 | 9,917 | → |
| Bir Dheb | Commune | بئر الذهب | 7,023 | 7,181 | → |
| Bir el-Ater | Commune | بئر العاتر | 59,264 | 77,727 | → |
| Bir Mokkadem | Commune | بئر المقدم | 12,479 | 12,907 | → |
| Boukhadra | Commune | بوخضرة | 9,963 | 10,701 | → |
| Boulhaf Dir | Commune | بولحاف الدير | 4,200 | 4,741 | → |
| Cheria | Commune | الشريعة | 64,638 | 75,344 | → |
| El Aouinet | Commune | العوينات | 19,385 | 21,682 | → |
| El Houidjbet | Commune | الحويجبات | 4,431 | 4,771 | → |
| El Kouif | Commune | الكويف | 15,777 | 17,319 | → |
| El Ma Labiodh | Commune | الماء الابيض | 9,917 | 11,397 | → |
| El Meridj | Commune | المريج | 10,254 | 11,713 | → |
| El Mezeraa | Commune | المزرعة | 5,145 | 4,251 | → |
| El Ogla | Commune | العقلة | 16,108 | 17,797 | → |
| Ferkane | Commune | فركان | 3,537 | 5,370 | → |
| Guorriguer | Commune | قوريقر | 5,708 | 5,415 | → |
| Hammamet | Commune | الحمامات | 15,879 | 20,148 | → |
| Morsott | Commune | مرسط | 16,331 | 17,238 | → |
| Negrine | Commune | نقرين | 5,891 | 9,445 | → |
| Ogla Melha | Commune | العقلة المالحة | 6,504 | 5,899 | → |
| Ouenza | Commune | الونزة | 45,881 | 52,737 | → |
| Oum Ali | Commune | أم على | 2,985 | 3,744 | → |
| Safsaf El Ouesra | Commune | صفصاف الوسرة | 5,531 | 6,074 | → |
| Stah Guentis | Commune | سطح قنطيس | 2,914 | 3,689 | → |
| Tébessa | Province Capital | تبسة | 161,440 | 196,537 | → |
| Tlidjene | Commune | ثليجان | 7,649 | 10,286 | → |
| Algérie [Algeria] | Republic | الجزائر | 29,100,867 | 34,080,030 |
Source: Office National des Statistiques de l'Algérie (web).
Further information about the population structure:
| Gender (C 2008) | |
|---|---|
| Males | 326,086 |
| Females | 322,617 |
| Age Groups (C 2008) | |
|---|---|
| 0-14 years | 189,547 |
| 15-64 years | 426,974 |
| 65+ years | 32,041 |
| Age Distribution (C 2008) | |
|---|---|
| 0-9 years | 120,393 |
| 10-19 years | 145,339 |
| 20-29 years | 139,090 |
| 30-39 years | 87,972 |
| 40-49 years | 68,022 |
| 50-59 years | 44,490 |
| 60-69 years | 22,618 |
| 70-79 years | 15,345 |
| 80+ years | 5,293 |
| Clustering (C 2008) | |
|---|---|
| in main locality | 515,786 |
| in other settlements | 25,665 |
| scattered | 107,254 |
