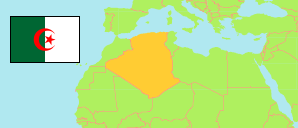
Laghouat
Province in Algeria
Contents: Subdivision
The population development in Laghouat as well as related information and services (Wikipedia, Google, images).
| Name | Status | Native | Population Census 1998-06-25 | Population Census 2008-04-14 | |
|---|---|---|---|---|---|
| Laghouat | Province | الأغواط | 317,125 | 455,602 | |
| Aflou | Commune | آفلو | 53,260 | 102,025 | → |
| Aïn Madhi | Commune | عين ماضي | 6,263 | 8,101 | → |
| Aïn Sidi Ali | Commune | عين سيدي على | 4,220 | 10,486 | → |
| Beidha | Commune | بيضاء | 7,381 | 8,761 | → |
| Bennasser Benchohra | Commune | بن ناصر بن شهرة | 7,948 | 9,621 | → |
| Brida | Commune | بريدة | 5,742 | 6,395 | → |
| El Assafia | Commune | العاسفية | 4,389 | 5,618 | → |
| El Ghicha | Commune | الغيشة | 5,719 | 6,079 | → |
| El Houaita | Commune | الحوايطة | 1,290 | 2,789 | → |
| Gueltat Sidi Saad | Commune | قلتة سيدي سعد | 10,629 | 12,567 | → |
| Hadj Mechri | Commune | حاج مشري | 6,197 | 6,357 | → |
| Hassi Delaa | Commune | حاسى دلاعة | 6,930 | 11,204 | → |
| Hassi R'Mel | Commune | حاسى الرمل | 16,791 | 22,133 | → |
| Kheneg | Commune | الخنق | 7,064 | 10,787 | → |
| Ksar El Hirane | Commune | قصر الحيران | 14,910 | 23,841 | → |
| Laghouat | Province Capital | الأغواط | 107,273 | 144,747 | → |
| Oued Morra | Commune | واد مرة | 4,748 | 5,700 | → |
| Oued M'Zi | Commune | واد مزي | 1,786 | 3,129 | → |
| Sebgag | Commune | سبقاق | 6,107 | 5,981 | → |
| Sidi Bouzid | Commune | سيدي بوزيد | 3,864 | 5,191 | → |
| Sidi Makhlouf | Commune | سيدي مخلوف | 8,061 | 12,292 | → |
| Tadjemout | Commune | تاجموت | 20,321 | 24,320 | → |
| Tadjrouna | Commune | تاجرونة | 3,597 | 4,306 | → |
| Taouila | Commune | تاويالة | 2,634 | 3,172 | → |
| Algérie [Algeria] | Republic | الجزائر | 29,100,867 | 34,080,030 |
Source: Office National des Statistiques de l'Algérie (web).
Further information about the population structure:
| Gender (C 2008) | |
|---|---|
| Males | 232,517 |
| Females | 223,085 |
| Age Groups (C 2008) | |
|---|---|
| 0-14 years | 152,906 |
| 15-64 years | 281,894 |
| 65+ years | 20,100 |
| Age Distribution (C 2008) | |
|---|---|
| 0-9 years | 103,916 |
| 10-19 years | 99,160 |
| 20-29 years | 91,398 |
| 30-39 years | 63,213 |
| 40-49 years | 44,112 |
| 50-59 years | 26,290 |
| 60-69 years | 14,127 |
| 70-79 years | 9,208 |
| 80+ years | 3,476 |
| Clustering (C 2008) | |
|---|---|
| in main locality | 371,207 |
| in other settlements | 22,197 |
| scattered | 62,198 |
