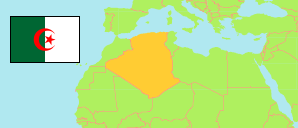
Chlef
Province in Algeria
Contents: Subdivision
The population development in Chlef as well as related information and services (Wikipedia, Google, images).
| Name | Status | Native | Population Census 1998-06-25 | Population Census 2008-04-14 | |
|---|---|---|---|---|---|
| Chlef | Province | الشلف | 858,695 | 1,002,088 | |
| Abou El Hassan | Commune | أبو الحسن | 20,164 | 22,756 | → |
| Aïn Merane | Commune | عين مران | 37,142 | 51,326 | → |
| Bénairia | Commune | بنايرية | 13,509 | 15,697 | → |
| Beni Bouateb | Commune | بنى بوعتاب | 2,551 | 2,069 | → |
| Beni Haoua | Commune | بنى حواء | 17,602 | 20,853 | → |
| Beni Rached | Commune | بنى راشد | 21,069 | 23,449 | → |
| Boukadir | Commune | بوقادير | 41,655 | 51,340 | → |
| Bouzeghaia | Commune | بوزغاية | 20,268 | 22,590 | → |
| Breira | Commune | بريرة | 11,808 | 13,200 | → |
| Chettia | Commune | الشطية | 59,960 | 71,408 | → |
| Chlef | Province Capital | الشلف | 146,157 | 178,616 | → |
| Dahra | Commune | الظهرة | 21,284 | 23,802 | → |
| El Hadjadj | Commune | الحجاج | 9,245 | 8,478 | → |
| El Karimia | Commune | الكريمية | 25,060 | 28,821 | → |
| El Marsa | Commune | المرسى | 9,726 | 10,807 | → |
| Harchoun | Commune | حرشون | 14,869 | 17,873 | → |
| Harenfa | Commune | الهرنفة | 16,356 | 17,799 | → |
| Labiod Medjadja | Commune | الابيض مجاجة | 13,920 | 14,733 | → |
| Moussadek | Commune | مصدق | 5,496 | 6,380 | → |
| Oued Fodda | Commune | وادى الفضة | 36,187 | 41,710 | → |
| Oued Goussine | Commune | وادى قوسين | 5,439 | 6,453 | → |
| Oued Sly | Commune | وادى سلى | 41,245 | 47,248 | → |
| Ouled Abbes | Commune | أولاد عباس | 7,330 | 8,578 | → |
| Ouled Ben Abdelkader | Commune | أولاد بن عبد القادر | 17,385 | 19,952 | → |
| Ouled Fares | Commune | أولاد فارس | 30,068 | 34,891 | → |
| Oum Drou | Commune | أم الذروع | 17,314 | 21,326 | → |
| Sendjas | Commune | السنجاس | 26,228 | 29,043 | → |
| Sidi Abderrahmane | Commune | سيدي عبد الرحمان | 3,630 | 4,349 | → |
| Sidi Akkacha | Commune | سيدى عكاشة | 23,374 | 26,595 | → |
| Sobha | Commune | صبحة | 28,646 | 34,455 | → |
| Tadjena | Commune | تأجنة | 22,155 | 24,413 | → |
| Talassa | Commune | تلعصة | 10,175 | 11,503 | → |
| Taougrite | Commune | تاوقريت | 24,267 | 27,574 | → |
| Ténès | Commune | تنس | 34,332 | 35,459 | → |
| Zeboudja | Commune | الزبوجة | 23,079 | 26,539 | → |
| Algérie [Algeria] | Republic | الجزائر | 29,100,867 | 34,080,030 |
Source: Office National des Statistiques de l'Algérie (web).
Further information about the population structure:
| Gender (C 2008) | |
|---|---|
| Males | 502,470 |
| Females | 499,618 |
| Age Groups (C 2008) | |
|---|---|
| 0-14 years | 285,758 |
| 15-64 years | 667,904 |
| 65+ years | 47,013 |
| Age Distribution (C 2008) | |
|---|---|
| 0-9 years | 185,913 |
| 10-19 years | 217,709 |
| 20-29 years | 228,506 |
| 30-39 years | 140,724 |
| 40-49 years | 96,337 |
| 50-59 years | 66,219 |
| 60-69 years | 34,165 |
| 70-79 years | 23,671 |
| 80+ years | 7,431 |
| Clustering (C 2008) | |
|---|---|
| in main locality | 521,069 |
| in other settlements | 267,275 |
| scattered | 213,741 |