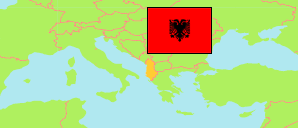
Libonik
Municipal Unit in Albania
Contents: Population
The population development of Libonik as well as related information and services (Wikipedia, Google, images).
| Name | Status | Population Census 2001-04-01 | Population Census 2011-10-01 | Population Census 2023-09-18 | |
|---|---|---|---|---|---|
| Libonik | Municipal Unit | 11,212 | 8,922 | 6,594 | |
| Shqipëria [Albania] | Republic | 3,069,275 | 2,821,977 | 2,402,113 |
Source: (2001) pop-stat.mashke.org, (2011) (2023) Instituti i Statistikës, Tiranë.
Explanation: Division according to the reorganization of 2014/15. Area figures are calculated using geospatial data.
Further information about the population structure:
| Gender (C 2023) | |
|---|---|
| Males | 3,334 |
| Females | 3,260 |
| Age Groups (C 2023) | |
|---|---|
| 0-14 years | 911 |
| 15-64 years | 4,192 |
| 65+ years | 1,491 |