
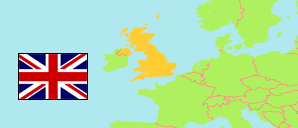
Hertfordshire
Grafschaft in Großbritannien & Nordirland
Übersicht: Gliederung
Die Bevölkerungsentwicklung in Hertfordshire sowie verwandte Informationen und Dienste (Wikipedia, Google, Bilder).
 verlinkt zu weiteren Informationen über eine ausgewählte Gebietseinheit inklusive ihrer Bevölkerungsstruktur (Geschlecht, Altersgruppen, Altersverteilung).
| Name | Status | Einwohner Schätzung 1981-06-30 | Einwohner Schätzung 1991-06-30 | Einwohner Schätzung 2001-06-30 | Einwohner Schätzung 2011-06-30 | Einwohner Schätzung 2021-06-30 | Einwohner Schätzung 2025-06-30 | |
|---|---|---|---|---|---|---|---|---|
| Hertfordshire | Grafschaft | 969.200 | 984.300 | 1.035.500 | 1.119.824 | 1.200.899 | 1.239.398 | |
| Broxbourne | Bezirk | 79.800 | 81.700 | 87.200 | 93.702 | 99.142 | 103.130 | → |
| Dacorum | Bezirk | 130.900 | 133.200 | 137.800 | 145.298 | 155.211 | 162.316 | → |
| East Hertfordshire | Bezirk | 110.000 | 117.300 | 129.100 | 138.155 | 150.662 | 158.033 | → |
| Hertsmere | Bezirk | 90.100 | 90.000 | 94.500 | 100.379 | 108.129 | 110.242 | → |
| North Hertfordshire | Bezirk | 108.600 | 112.400 | 117.100 | 127.494 | 133.583 | 137.365 | → |
| St Albans | Bezirk | 125.300 | 126.200 | 129.200 | 141.248 | 148.624 | 150.757 | → |
| Stevenage | Bezirk | 74.700 | 75.700 | 79.800 | 84.247 | 89.360 | 92.081 | → |
| Three Rivers | Bezirk | 81.100 | 79.000 | 82.900 | 87.921 | 93.934 | 96.068 | → |
| Watford | Bezirk | 74.600 | 74.900 | 80.400 | 90.653 | 102.507 | 107.658 | → |
| Welwyn Hatfield | Bezirk | 94.200 | 93.800 | 97.600 | 110.727 | 119.747 | 121.748 | → |
| Great Britain and Northern Ireland [Großbritannien und Nordirland] | Vereinigtes Königreich | 56.357.500 | 57.438.700 | 59.113.000 | 63.285.145 | 66.983.488 | 69.487.000 |
Quelle: UK National Statistics, National Records of Scotland, The Northern Ireland Statistics and Research Agency.
Erläuterung: Die Bevölkerungsschätzungen 2025 für Nordirland liegen noch nicht vor.
Weitere Informationen zur Bevölkerungstruktur:
| Geschlecht (E 2025) | |
|---|---|
| männlich | 604.671 |
| weiblich | 634.727 |
| Altersgruppen (E 2025) | |
|---|---|
| 0-17 Jahre | 273.958 |
| 18-64 Jahre | 744.135 |
| ≥65 Jahre | 221.305 |
| Altersverteilung (E 2025) | |
|---|---|
| ≥90 Jahre | 12.978 |
| 80-89 Jahre | 52.465 |
| 70-79 Jahre | 96.043 |
| 60-69 Jahre | 134.611 |
| 50-59 Jahre | 164.762 |
| 40-49 Jahre | 177.316 |
| 30-39 Jahre | 173.712 |
| 20-29 Jahre | 129.379 |
| 10-19 Jahre | 154.459 |
| 0-9 Jahre | 143.673 |