
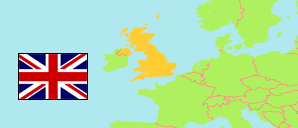
Cambridgeshire
Grafschaft in Großbritannien & Nordirland
Übersicht: Gliederung
Die Bevölkerungsentwicklung in Cambridgeshire sowie verwandte Informationen und Dienste (Wikipedia, Google, Bilder).
 verlinkt zu weiteren Informationen über eine ausgewählte Gebietseinheit inklusive ihrer Bevölkerungsstruktur (Geschlecht, Altersgruppen, Altersverteilung).
| Name | Status | Einwohner Schätzung 1981-06-30 | Einwohner Schätzung 1991-06-30 | Einwohner Schätzung 2001-06-30 | Einwohner Schätzung 2011-06-30 | Einwohner Schätzung 2021-06-30 | Einwohner Schätzung 2025-06-30 | |
|---|---|---|---|---|---|---|---|---|
| Cambridgeshire | Grafschaft | 455.600 | 510.600 | 554.700 | 622.312 | 680.747 | 716.983 | |
| Cambridge | Bezirk | 101.000 | 106.700 | 109.900 | 122.725 | 145.022 | 149.872 | → |
| East Cambridgeshire | Bezirk | 54.000 | 60.900 | 73.400 | 84.245 | 88.125 | 94.599 | → |
| Fenland | Bezirk | 66.500 | 75.100 | 83.700 | 95.461 | 102.731 | 105.930 | → |
| Huntingdonshire | Bezirk | 125.200 | 146.100 | 157.200 | 170.039 | 181.827 | 191.941 | → |
| South Cambridgeshire | Bezirk | 108.900 | 121.900 | 130.500 | 149.842 | 163.042 | 174.641 | → |
| Great Britain and Northern Ireland [Großbritannien und Nordirland] | Vereinigtes Königreich | 56.357.500 | 57.438.700 | 59.113.000 | 63.285.145 | 66.983.488 | 69.487.000 |
Quelle: UK National Statistics, National Records of Scotland, The Northern Ireland Statistics and Research Agency.
Erläuterung: Die Bevölkerungsschätzungen 2025 für Nordirland liegen noch nicht vor.
Weitere Informationen zur Bevölkerungstruktur:
| Geschlecht (E 2025) | |
|---|---|
| männlich | 353.387 |
| weiblich | 363.596 |
| Altersgruppen (E 2025) | |
|---|---|
| 0-17 Jahre | 139.938 |
| 18-64 Jahre | 438.896 |
| ≥65 Jahre | 138.149 |
| Altersverteilung (E 2025) | |
|---|---|
| ≥90 Jahre | 6.913 |
| 80-89 Jahre | 32.615 |
| 70-79 Jahre | 62.601 |
| 60-69 Jahre | 79.465 |
| 50-59 Jahre | 92.290 |
| 40-49 Jahre | 93.974 |
| 30-39 Jahre | 99.772 |
| 20-29 Jahre | 92.155 |
| 10-19 Jahre | 83.706 |
| 0-9 Jahre | 73.492 |