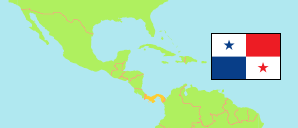
Veraguas
Provinz in Panama
Übersicht: Gliederung
Die Einwohnerentwicklung in Veraguas sowie verwandte Informationen und Dienste (Wikipedia, Google, Bilder).
| Name | Status | Einwohner Zensus 2000-05-14 | Einwohner Zensus 2010-05-16 | Einwohner Zensus 2023-01-08 | |
|---|---|---|---|---|---|
| Veraguas | Provinz | 209.076 | 226.991 | 259.791 | |
| Atalaya | Bezirk | 8.916 | 10.205 | 17.507 | → |
| Calobre | Bezirk | 12.184 | 11.493 | 11.666 | → |
| Cañazas | Bezirk | 15.999 | 16.830 | 16.933 | → |
| La Mesa | Bezirk | 11.746 | 11.631 | 12.238 | → |
| Las Palmas | Bezirk | 17.924 | 17.566 | 18.071 | → |
| Mariato | Bezirk | 5.451 | 5.296 | 5.791 | → |
| Montijo | Bezirk | 6.760 | 6.572 | 6.784 | → |
| Río de Jesús | Bezirk | 5.256 | 5.102 | 4.822 | → |
| San Francisco | Bezirk | 9.899 | 9.881 | 10.107 | → |
| Santa Fe | Bezirk | 12.890 | 15.585 | 18.023 | → |
| Santiago | Bezirk | 74.679 | 88.997 | 109.605 | → |
| Soná | Bezirk | 27.372 | 27.833 | 28.244 | → |
| Panamá | Republik | 2.839.177 | 3.405.813 | 4.202.572 |
Quelle: Instituto Nacional de Estadística y Censo, Panamá.
Erläuterung: Die dargestellten Zensusergebnisse berücksichtigen keine Untererfassung. Die Gesamteinwohnerzahl 2023 enthält 137.792 Personen aus Verwaltungsregistern; diese sind nicht in den Provinz- und Bezirkangaben enthalten. Die Flächenangaben für Bezirke wurden aus Geodaten berechnet.
Weitere Informationen zur Bevölkerungstruktur:
| Geschlecht (C 2023) | |
|---|---|
| männlich | 133.287 |
| weiblich | 126.504 |
| Altersgruppen (C 2023) | |
|---|---|
| 0-14 Jahre | 63.513 |
| 15-64 Jahre | 164.158 |
| ≥65 Jahre | 32.120 |
| Altersverteilung (C 2023) | |
|---|---|
| ≥90 Jahre | 1.500 |
| 80-89 Jahre | 7.098 |
| 70-79 Jahre | 13.847 |
| 60-69 Jahre | 21.376 |
| 50-59 Jahre | 27.338 |
| 40-49 Jahre | 30.615 |
| 30-39 Jahre | 33.645 |
| 20-29 Jahre | 39.282 |
| 10-19 Jahre | 43.476 |
| 0-9 Jahre | 41.614 |
| Urbanisierung (C 2023) | |
|---|---|
| ländlich | 166.123 |
| urban | 93.668 |
| Ethnische Gruppe (C 2023) | |
|---|---|
| Ngäbe | 13.191 |
| Kuna | 251 |
| andere Indigene | 7.001 |
| afrikanisch, nicht indigen | 55.140 |
| nicht afrikanisch, nicht indigen | 184.208 |