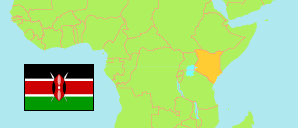
Kirinyaga East
Subcounty in Kenia
Übersicht: Einwohner
Die Einwohnerentwicklung von Kirinyaga East sowie verwandte Informationen und Dienste (Wikipedia, Google, Bilder).
| Name | Status | Einwohner Zensus 2009-08-24 | Einwohner Zensus 2019-08-24 | |
|---|---|---|---|---|
| Kirinyaga East | Subcounty | 124.672 | 135.559 | |
| Kenya [Kenia] | Republik | 38.610.097 | 47.564.296 |
Quelle: Kenya National Bureau of Statistics.
Weitere Informationen zur Bevölkerungstruktur:
| Geschlecht (C 2019) | |
|---|---|
| männlich | 67.037 |
| weiblich | 68.514 |
| divers | 8 |
| Altersgruppen (C 2019) | |
|---|---|
| 0-14 Jahre | 37.279 |
| 15-64 Jahre | 88.021 |
| ≥65 Jahre | 10.247 |
| Altersverteilung (C 2019) | |
|---|---|
| ≥90 Jahre | 812 |
| 80-89 Jahre | 1.801 |
| 70-79 Jahre | 4.113 |
| 60-69 Jahre | 7.718 |
| 50-59 Jahre | 14.093 |
| 40-49 Jahre | 18.645 |
| 30-39 Jahre | 21.458 |
| 20-29 Jahre | 17.224 |
| 10-19 Jahre | 25.706 |
| 0-9 Jahre | 23.977 |