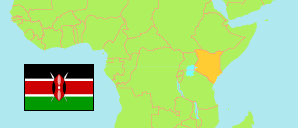
Kiambu
County in Kenia
Übersicht: Gliederung
Die Einwohnerentwicklung in Kiambu sowie verwandte Informationen und Dienste (Wikipedia, Google, Bilder).
| Name | Status | Einwohner Zensus 2009-08-24 | Einwohner Zensus 2019-08-24 | |
|---|---|---|---|---|
| Kiambu | County | 1.623.282 | 2.417.735 | |
| Gatundu North | Subcounty | 106.376 | 109.870 | → |
| Gatundu South | Subcounty | 108.415 | 122.103 | → |
| Githunguri | Subcounty | 147.763 | 165.232 | → |
| Juja | Subcounty | 118.793 | 300.948 | → |
| Kabete | Subcounty | 140.427 | 199.653 | → |
| Kiambaa | Subcounty | 145.053 | 236.400 | → |
| Kiambu | Subcounty | 108.698 | 145.903 | → |
| Kikuyu | Subcounty | 125.402 | 187.122 | → |
| Lari | Subcounty | 123.895 | 135.303 | → |
| Limuru | Subcounty | 131.132 | 159.314 | → |
| Ruiru | Subcounty | 201.986 | 371.111 | → |
| Thika East | Subcounty | 26.570 | 38.956 | → |
| Thika West | Subcounty | 138.772 | 245.820 | → |
| Kenya [Kenia] | Republik | 38.610.097 | 47.564.296 |
Quelle: Kenya National Bureau of Statistics.
Weitere Informationen zur Bevölkerungstruktur:
| Geschlecht (C 2019) | |
|---|---|
| männlich | 1.187.146 |
| weiblich | 1.230.454 |
| divers | 135 |
| Altersgruppen (C 2019) | |
|---|---|
| 0-14 Jahre | 747.271 |
| 15-64 Jahre | 1.584.244 |
| ≥65 Jahre | 86.037 |
| Altersverteilung (C 2019) | |
|---|---|
| ≥90 Jahre | 4.546 |
| 80-89 Jahre | 14.400 |
| 70-79 Jahre | 37.116 |
| 60-69 Jahre | 68.960 |
| 50-59 Jahre | 144.707 |
| 40-49 Jahre | 255.653 |
| 30-39 Jahre | 410.924 |
| 20-29 Jahre | 522.054 |
| 10-19 Jahre | 439.251 |
| 0-9 Jahre | 519.941 |