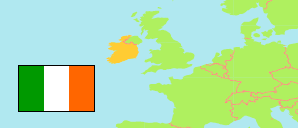
Wicklow
Grafschaft in Irland
Übersicht: Einwohner
Die Einwohnerentwicklung von Wicklow sowie verwandte Informationen und Dienste (Wikipedia, Google, Bilder).
| Name | Status | Einwohner Zensus 1981-04-05 | Einwohner Zensus 1986-04-13 | Einwohner Zensus 1991-04-21 | Einwohner Zensus 1996-04-28 | Einwohner Zensus 2002-04-28 | Einwohner Zensus 2006-04-23 | Einwohner Zensus 2011-04-10 | Einwohner Zensus 2016-04-24 | Einwohner Zensus 2022-04-03 | |
|---|---|---|---|---|---|---|---|---|---|---|---|
| Wicklow | Grafschaft | 87.449 | 94.542 | 97.265 | 102.683 | 114.676 | 126.194 | 136.640 | 142.425 | 155.851 | |
| Ireland (Éire) [Irland] | Republik | 3.443.405 | 3.540.643 | 3.525.719 | 3.626.087 | 3.917.203 | 4.239.848 | 4.588.252 | 4.761.865 | 5.149.139 |
Quelle: Central Statistics Office, Ireland.
Weitere Informationen zur Bevölkerungstruktur:
| Geschlecht (C 2022) | |
|---|---|
| männlich | 76.564 |
| weiblich | 79.287 |
| Altersgruppen (C 2022) | |
|---|---|
| 0-17 Jahre | 38.937 |
| 18-64 Jahre | 93.253 |
| ≥65 Jahre | 23.661 |
| Altersverteilung (C 2022) | |
|---|---|
| ≥90 Jahre | 777 |
| 80-89 Jahre | 4.460 |
| 70-79 Jahre | 11.147 |
| 60-69 Jahre | 15.977 |
| 50-59 Jahre | 20.854 |
| 40-49 Jahre | 25.109 |
| 30-39 Jahre | 19.705 |
| 20-29 Jahre | 15.008 |
| 10-19 Jahre | 22.877 |
| 0-9 Jahre | 19.937 |
| Geburtsland (C 2022) | |
|---|---|
| Irland | 128.478 |
| anderer Staat | 27.373 |
| Religion (C 2022) | |
|---|---|
| katholisch | 99.324 |
| andere Religion | 18.367 |
| keine Religion | 30.649 |