Provinces
The population of the provinces of Burundi by census years.
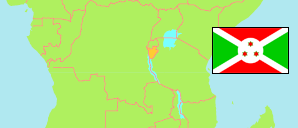
Provinces according to the territorial reform of 2023.
| Name | Abbr. | Capital | Area A (km²) | Population Census (C) 1979-08-15 | Population Census (C) 1990-08-16 | Population Census (Cf) 2008-08-16 | Population Census (Cp) 2024-08-16 | ||
|---|---|---|---|---|---|---|---|---|---|
| Buhumuza | BHM | Cankuzo | 5,931 | 532,791 | 754,746 | 1,261,812 | 2,052,261 | 593100 | → |
| Bujumbura | BJB | Bujumbura | 3,937 | 794,891 | 1,111,727 | 1,874,266 | 3,353,555 | 393700 | → |
| Burunga | BRG | Makamba | 6,206 | 575,270 | 805,123 | 1,351,719 | 2,118,551 | 620600 | → |
| Butanyerera | BTY | Ngozi | 4,480 | 1,066,617 | 1,326,465 | 1,905,622 | 2,530,206 | 448000 | → |
| Gitega | GIT | Gitega | 4,546 | 1,058,851 | 1,294,732 | 1,660,155 | 2,278,215 | 454600 | → |
| Burundi | BDI | Bujumbura | 27,834 | 4,028,420 | 5,292,793 | 8,053,574 | 12,332,788 | → |
- The area figures of provinces are calculated using geospatial data. The total area includes inland waters.
- L'Institut de Statistiques et d’Etudes Economiques du Burundi.
Major Cities
| Name | Adm. | Population Census (Cf) 2008-08-16 | |
|---|---|---|---|
| 1 | Bujumbura | BJB | 497,166 |
| 2 | Gitega | GIT | 41,944 |
| 3 | Ngozi | BTY | 39,884 |
| 4 | Rumonge | BRG | 35,931 |
| 5 | Cibitoke | BJB | 23,885 |
| 6 | Kayanza | BTY | 21,767 |
| 7 | Bubanza | BJB | 20,031 |
Major Urban Agglomeration
| Name | Adm. | Population Census (Cp) 2024-08-16 | |
|---|---|---|---|
| 1 | Bujumbura | BJB | 1,249,519 |
Contents: Cities & Urban Localities
The population of all Burundian cities and urban localities with a population of more than 2,000 inhabitants by census years.
| Name | Adm. | Population Census (C) 1990-08-16 | Population Census (Cf) 2008-08-16 | Area | |
|---|---|---|---|---|---|
| Bubanza | BJB | 2,945 | 20,031 | 0 | → |
| Bujumbura | BJB | 235,440 | 497,166 | 0 | → |
| Bururi | BRG | ... | 4,478 | 0 | → |
| Bwambarangwe | BTY | ... | 4,044 | 0 | → |
| Cankuzo | BHM | 1,643 | 3,624 | 0 | → |
| Cibitoke | BJB | 8,280 | 23,885 | 0 | → |
| Gatumba | BJB | ... | 11,700 | 0 | → |
| Gitega | GIT | 20,708 | 41,944 | 0 | → |
| Giteranyi | BHM | ... | 2,146 | 0 | → |
| Isale | BJB | ... | 4,977 | 0 | → |
| Kanyosha | BJB | ... | 4,272 | 0 | → |
| Karuzi | GIT | 3,403 | 10,317 | 0 | → |
| Kayanza | BTY | 6,881 | 21,767 | 0 | → |
| Kayogoro | BRG | ... | 3,538 | 0 | → |
| Kirundo | BTY | 5,181 | 10,024 | 0 | → |
| Mabanda | BRG | ... | 3,249 | 0 | → |
| Makamba | BRG | 5,198 | 9,396 | 0 | → |
| Matana | BRG | ... | 2,054 | 0 | → |
| Mugongomanga | BJB | ... | 2,086 | 0 | → |
| Muramvya | GIT | 2,290 | 5,458 | 0 | → |
| Muyinga | BHM | 5,533 | 9,609 | 0 | → |
| Mwaro | GIT | ... | 2,403 | 0 | → |
| Ngozi | BTY | 14,511 | 39,884 | 0 | → |
| Rumonge | BRG | 15,816 | 35,931 | 0 | → |
| Rutana | BRG | 1,944 | 5,865 | 0 | → |
| Ruyigi | BHM | 2,377 | 7,139 | 0 | → |
- (1990) Artikel "Liste der Städte in Burundi". In: Wikipedia, 30. März 2007.
(2008) République de Burundi: Annuaire Statistique du Burundi 2010, July 2012. The urban population of communes is tabulated.
Population Structure
Further information about the population structure.
| Gender (C 2024) | |
|---|---|
| Males | 5,901,069 |
| Females | 6,431,719 |
| Age Groups (C 2024) | |
|---|---|
| 0-14 years | 5,505,806 |
| 15-64 years | 6,287,160 |
| 65+ years | 427,968 |
| Age Distribution (C 2024) | |
|---|---|
| 80+ years | 66,698 |
| 70-79 years | 188,021 |
| 60-69 years | 432,794 |
| 50-59 years | 579,201 |
| 40-49 years | 908,659 |
| 30-39 years | 1,420,906 |
| 20-29 years | 1,782,755 |
| 10-19 years | 2,984,549 |
| 0-9 years | 3,857,351 |
| Urbanization (C 2024) | |
|---|---|
| Rural | 9,255,195 |
| Urban | 3,077,593 |