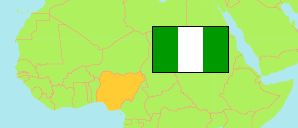
Nigeria: Metro Lagos
Contents: Local Government Areas
The population of the Local Government Areas (LGAs) of Metropolitan Lagos according to census results and latest population projections.
| Name | Status | Population Census 1991-11-26 | Population Census 2006-03-21 | Population Projection 2019-03-21 | |
|---|---|---|---|---|---|
| Agege | Local Government Area | 417,981 | 1,033,064 | 1,555,800 | → |
| Ajeromi-Ifelodun | Local Government Area | 593,561 | 1,435,295 | 2,161,600 | → |
| Alimosho | Local Government Area | 430,890 | 2,047,026 | 3,082,900 | → |
| Amuwo-Odofin | Local Government Area | 225,823 | 524,971 | 790,600 | → |
| Apapa | Local Government Area | 154,477 | 522,384 | 786,700 | → |
| Eti-Osa | Local Government Area | 157,387 | 983,515 | 1,481,200 | → |
| Ifako-Ijaye | Local Government Area | 233,341 | 744,323 | 1,121,000 | → |
| Ikeja | Local Government Area | 203,383 | 648,720 | 977,000 | → |
| Kosofe | Local Government Area | 412,407 | 934,614 | 1,407,600 | → |
| Lagos Island | Local Government Area | 165,996 | 859,849 | 1,295,000 | → |
| Lagos Mainland | Local Government Area | 273,079 | 629,469 | 948,000 | → |
| Mushin | Local Government Area | 539,783 | 1,321,517 | 1,990,300 | → |
| Ojo | Local Government Area | 215,837 | 941,523 | 1,418,000 | → |
| Oshodi-Isolo | Local Government Area | 449,781 | 1,134,548 | 1,708,700 | → |
| Shomolu | Local Government Area | 358,787 | 1,025,123 | 1,543,900 | → |
| Surulere | Local Government Area | 462,261 | 1,274,362 | 1,919,200 | → |
| Lagos | Metropolitan Area | 5,294,774 | 16,060,303 | 24,187,400 |
Source: (1991) (2006 details) National Population Commission of Nigeria (web). (2006) (2019) Lagos Bureau of Statistics (web).
Explanation: The reliability of the presented census figures is not very high. The National Population Commission reports a census population of 8,048,430 for Metro Lagos in 2006. Area figures are computed by using geospatial data.