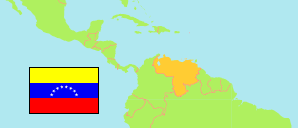
Zulia
State in Venezuela
Contents: Subdivision
The population development in Zulia as well as related information and services (Wikipedia, Google, images).
| Name | Status | Population Estimate 2001-06-30 | Population Estimate 2011-06-30 | Population Projection 2019-06-30 | |
|---|---|---|---|---|---|
| Zulia | State | 3,227,280 | 3,835,233 | 4,311,625 | |
| Almirante Padilla | Municipality | 10,117 | 12,333 | 14,111 | → |
| Baralt | Municipality | 76,608 | 92,080 | 104,429 | → |
| Cabimas | Municipality | 235,292 | 276,734 | 308,465 | → |
| Catatumbo | Municipality | 34,079 | 40,991 | 46,518 | → |
| Colón | Municipality | 108,328 | 128,172 | 143,540 | → |
| Francisco Javier Pulgar | Municipality | 28,606 | 33,696 | 37,607 | → |
| Guajira (Páez) | Municipality | 59,757 | 69,004 | 75,784 | → |
| Jesús Enrique Lossada | Municipality | 103,048 | 120,695 | 134,080 | → |
| Jesús María Semprún | Municipality | 26,641 | 30,948 | 34,162 | → |
| La Cañada de Urdaneta | Municipality | 69,503 | 83,195 | 94,046 | → |
| Lagunillas | Municipality | 178,756 | 205,929 | 225,745 | → |
| Machiques de Perijá | Municipality | 107,704 | 126,268 | 140,384 | → |
| Mara | Municipality | 183,544 | 209,729 | 228,416 | → |
| Maracaibo | Municipality | 1,288,515 | 1,546,680 | 1,752,602 | → |
| Miranda | Municipality | 83,710 | 99,648 | 112,157 | → |
| Rosario de Perijá | Municipality | 71,827 | 86,297 | 97,838 | → |
| San Francisco | Municipality | 374,183 | 453,997 | 518,813 | → |
| Santa Rita | Municipality | 52,515 | 60,568 | 66,465 | → |
| Simón Bolívar | Municipality | 36,196 | 43,601 | 49,532 | → |
| Sucre | Municipality | 53,775 | 61,904 | 67,830 | → |
| Valmore Rodríguez | Municipality | 44,576 | 52,764 | 59,101 | → |
| Venezuela | Republic | 24,802,885 | 28,944,070 | 32,219,521 |
Source: Instituto Nacional de Estadística, Venezuela (web).
Explanation: The population projection does not consider emigration caused by the current economical and political situation in Venezuela.
Further information about the population structure:
| Gender (C 2011) | |
|---|---|
| Males | 1,852,389 |
| Females | 1,852,015 |
| Age Groups (C 2011) | |
|---|---|
| 0-14 years | 1,057,974 |
| 15-64 years | 2,450,010 |
| 65+ years | 196,420 |
| Age Distribution (C 2011) | |
|---|---|
| 0-9 years | 702,128 |
| 10-19 years | 727,331 |
| 20-29 years | 683,854 |
| 30-39 years | 539,507 |
| 40-49 years | 421,461 |
| 50-59 years | 323,823 |
| 60-69 years | 179,391 |
| 70-79 years | 85,376 |
| 80+ years | 41,533 |
| Urbanization (C 2011) | |
|---|---|
| Rural | 292,798 |
| Urban | 3,411,606 |
| Ethnic Group (C 2011) | |
|---|---|
| Indigenous | 443,544 |
| Afro-Venezuelan | 90,339 |
| Mestizos | 1,631,554 |
| White | 1,501,490 |
| Other Ethnic Group | 19,383 |
| Literacy (A10+) (C 2011) | |
|---|---|
| yes | 2,796,845 |
| no | 205,431 |