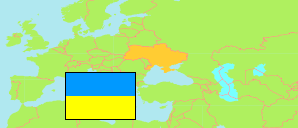
Dnipropetrovs'k
Oblast in Ukraine
Contents: Subdivision
The population development in Dnipropetrovs'k as well as related information and services (Wikipedia, Google, images).
| Name | Status | Native | Population Census 1989-01-21 | Population Census 2001-12-05 | Population Estimate 2022-01-01 | |
|---|---|---|---|---|---|---|
| Dnipropetrovs'k [Dnipropetrovsk] | Oblast | Дніпропетровська область | 3,881,224 | 3,567,567 | 3,096,485 | |
| Dniprovs'kyj rajon [Dnipro] | District | Дніпровський район | ... | 1,264,154 | 1,145,065 | → |
| Kam'jans'kyj rajon [Kamianske] | District | Кам'янський район | 539,760 | 491,491 | 423,443 | → |
| Kryvoriz'kyj rajon [Kryvyi Rih] | District | Криворізький район | 951,892 | 880,433 | 743,934 | → |
| Nikopol's'kyj rajon [Nikopol] | District | Нікопольський район | 340,659 | 309,716 | 250,746 | → |
| Novomoskovs'kyj rajon [Novomoskovsk] | District | Новомосковський район | ... | 180,928 | 167,526 | → |
| Pavlohrads'kyj rajon [Pavlohrad] | District | Павлоградський район | ... | 196,745 | 166,797 | → |
| Synel'nykivs'kyj rajon [Synelnykove] | District | Синельниківський район | ... | 244,100 | 198,974 | → |
Source: State Statistics Committee of Ukraine (web), pop-stat.mashke.org, Federal State Statistics Service Russia (web).
Explanation: The Autonomous Republic of Crimea and Sevastopol were annexed by Russia in March 2014. This new status is not internationally recognised. Their 2022 figures refer to the results of the Russian census in October 2021.
Parts of Donetsk oblast and of Luhansk oblast are not under control of the central government; their 2022 population was calculated by the Ukrainian statistical office "according to available administrative data". These figures are probably too high.
The Russian invasion of Ukraine since February 2022 has considerably impacts on the number and distribution of the population in Ukraine.
Further information about the population structure:
| Gender (E 2022) | |
|---|---|
| Males | 1,412,426 |
| Females | 1,680,750 |
| Age Groups (E 2022) | |
|---|---|
| 0-17 years | 559,800 |
| 18-64 years | 1,988,821 |
| 65+ years | 544,555 |
| Urbanization (E 2022) | |
|---|---|
| Rural | 490,406 |
| Urban | 2,606,079 |