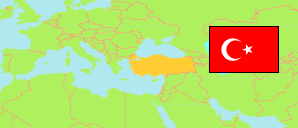
Çaycuma
District in Zonguldak
District
The population development of Çaycuma.
| Name | Status | Population Estimate 2009-12-31 | Population Estimate 2013-12-31 | Population Estimate 2017-12-31 | Population Estimate 2022-12-31 | |
|---|---|---|---|---|---|---|
| Çaycuma | District | 96,615 | 92,690 | 90,860 | 90,583 | → |
| Zonguldak | Province | 619,812 | 601,567 | 596,892 | 588,510 |
Contents: Cities, Towns and Villages
The population development of the cities, towns and villages in Çaycuma.
| Name | Status | District | Population Estimate 2009-12-31 | Population Estimate 2013-12-31 | Population Estimate 2017-12-31 | Population Estimate 2022-12-31 | |
|---|---|---|---|---|---|---|---|
| Ahatlı | Village | Çaycuma | 1,739 | 1,638 | 1,634 | 1,614 | → |
| Akyamaç | Village | Çaycuma | 843 | 832 | 807 | 804 | → |
| Basat | Village | Çaycuma | 1,168 | 977 | 930 | 855 | → |
| Çaycuma | City | Çaycuma | 22,469 | 26,032 | 27,457 | 30,254 | → |
| Çayır | Village | Çaycuma | 1,125 | 984 | 815 | 771 | → |
| Çomranlı | Village | Çaycuma | 1,021 | 917 | 834 | 796 | → |
| Dereköseler | Village | Çaycuma | 1,367 | 1,219 | 1,181 | 1,057 | → |
| Dursunlar | Village | Çaycuma | 1,033 | 917 | 831 | 824 | → |
| Filyos | Town | Çaycuma | 5,776 | 5,137 | 4,952 | 4,847 | → |
| Hacıibadi | Village | Çaycuma | 965 | 888 | 819 | 806 | → |
| Hacılar | Village | Çaycuma | 1,338 | 1,321 | 1,191 | 1,217 | → |
| Helvacılar | Village | Çaycuma | 1,644 | 1,415 | 1,312 | 1,238 | → |
| Karapınar | Town | Çaycuma | 2,725 | 2,567 | 2,368 | 2,690 | → |
| Kayıkçılar | Village | Çaycuma | 1,434 | 1,358 | 1,374 | 1,320 | → |
| Kerimler | Village | Çaycuma | 1,467 | 1,427 | 1,379 | 1,335 | → |
| Kızılbel | Village | Çaycuma | 1,172 | 1,008 | 940 | 836 | → |
| Koramanlar | Village | Çaycuma | 1,357 | 1,314 | 1,341 | 1,278 | → |
| Muharremşah | Village | Çaycuma | 1,353 | 1,222 | 1,103 | 1,067 | → |
| Muhsinler | Village | Çaycuma | 1,001 | 900 | 845 | 783 | → |
| Nebioğlu | Town | Çaycuma | 2,437 | 2,236 | 2,080 | 2,245 | → |
| Perşembe | Town | Çaycuma | 2,723 | 2,555 | 2,557 | 2,671 | → |
| Saltukova | Town | Çaycuma | 3,906 | 3,920 | ... | 3,993 | → |
| Sandallar | Village | Çaycuma | 994 | 927 | 836 | 787 | → |
| Şehler | Village | Çaycuma | 923 | 814 | 797 | 755 | → |
Source: State Institute of Statistics, Republic of Türkiye.
Explanation: Since 2013, the population figures of cities in metropolitan provinces are calculated by using the population of selected neighborhoods.