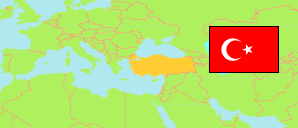
Manisa
Metropolitan Province in Turkey
Contents: Subdivision
The population development in Manisa as well as related information and services (Wikipedia, Google, images).
| Name | Status | Population Estimate 2009-12-31 | Population Estimate 2013-12-31 | Population Estimate 2017-12-31 | Population Estimate 2023-12-31 | |
|---|---|---|---|---|---|---|
| Manisa | Metropolitan Province | 1,331,957 | 1,359,463 | 1,413,041 | 1,475,716 | |
| Ahmetli | District | 16,037 | 16,266 | 16,150 | 17,370 | → |
| Akhisar | District | 158,857 | 161,918 | 167,883 | 178,812 | → |
| Alaşehir | District | 99,851 | 99,504 | 102,731 | 105,397 | → |
| Demirci | District | 50,533 | 43,628 | 41,129 | 35,868 | → |
| Gölmarmara | District | 15,993 | 15,449 | 15,243 | 15,211 | → |
| Gördes | District | 32,070 | 30,341 | 28,368 | 26,240 | → |
| Kırkağaç | District | 47,148 | 46,160 | 42,716 | 37,823 | → |
| Köprübaşı | District | 9,830 | 14,045 | 13,285 | 12,752 | → |
| Kula | District | 47,521 | 45,892 | 44,403 | 43,361 | → |
| Salihli | District | 155,333 | 156,330 | 160,810 | 165,182 | → |
| Sarıgöl | District | 36,179 | 36,209 | 36,023 | 35,519 | → |
| Saruhanlı | District | 56,584 | 53,821 | 54,259 | 57,452 | → |
| Şehzadeler | District | ... | 164,649 | 170,953 | 166,541 | → |
| Selendi | District | 23,791 | 22,047 | 20,334 | 19,115 | → |
| Soma | District | 101,011 | 105,391 | 108,838 | 111,276 | → |
| Turgutlu | District | 140,753 | 148,130 | 160,183 | 177,071 | → |
| Yunusemre | District | ... | 199,683 | 229,733 | 270,726 | → |
| Türkiye [Turkey] | Republic | 72,561,312 | 76,667,864 | 80,810,525 | 85,372,377 |
Source: State Institute of Statistics, Republic of Türkiye.
Explanation: Area figures of districts are computed by using geospatial data.
Further information about the population structure:
| Gender (E 2023) | |
|---|---|
| Males | 741,274 |
| Females | 734,442 |
| Age Groups (E 2023) | |
|---|---|
| 0-14 years | 285,351 |
| 15-64 years | 1,003,932 |
| 65+ years | 186,433 |
| Age Distribution (E 2023) | |
|---|---|
| 90+ years | 4,442 |
| 80-89 years | 28,678 |
| 70-79 years | 83,781 |
| 60-69 years | 154,747 |
| 50-59 years | 188,996 |
| 40-49 years | 219,354 |
| 30-39 years | 209,531 |
| 20-29 years | 202,183 |
| 10-19 years | 199,222 |
| 0-9 years | 184,782 |