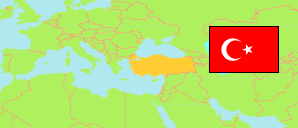
İzmir
Metropolitan Province in Turkey
Contents: Subdivision
The population development in İzmir as well as related information and services (Wikipedia, Google, images).
| Name | Status | Population Estimate 2009-12-31 | Population Estimate 2013-12-31 | Population Estimate 2017-12-31 | Population Estimate 2023-12-31 | |
|---|---|---|---|---|---|---|
| İzmir | Metropolitan Province | 3,868,308 | 4,061,074 | 4,279,677 | 4,479,525 | |
| Aliağa | District | 63,503 | 80,948 | 94,070 | 106,168 | → |
| Balçova | District | 77,915 | 77,624 | 78,442 | 77,831 | → |
| Bayındır | District | 41,244 | 40,690 | 40,258 | 40,618 | → |
| Bayraklı | District | 306,427 | 310,656 | 314,402 | 300,949 | → |
| Bergama | District | 100,802 | 101,217 | 102,961 | 107,133 | → |
| Beydağ | District | 13,047 | 12,555 | 12,391 | 12,094 | → |
| Bornova | District | 409,009 | 426,490 | 442,839 | 447,553 | → |
| Buca | District | 415,967 | 454,112 | 492,252 | 523,487 | → |
| Çeşme | District | 32,475 | 35,965 | 41,278 | 50,028 | → |
| Çiğli | District | 154,397 | 173,667 | 190,607 | 215,172 | → |
| Dikili | District | 31,907 | 36,124 | 41,697 | 48,379 | → |
| Foça | District | 30,779 | 32,534 | 31,061 | 36,000 | → |
| Gaziemir | District | 121,255 | 129,534 | 136,273 | 137,768 | → |
| Güzelbahçe | District | 24,296 | 27,389 | 31,429 | 38,044 | → |
| Karabağlar | District | 449,707 | 471,676 | 480,790 | 476,500 | → |
| Karaburun | District | 8,889 | 9,092 | 9,812 | 13,379 | → |
| Karşıyaka | District | 304,507 | 321,870 | 342,062 | 341,857 | → |
| Kemalpaşa | District | 89,084 | 97,499 | 105,506 | 117,956 | → |
| Kınık | District | 28,550 | 28,000 | 28,271 | 29,205 | → |
| Kiraz | District | 44,436 | 44,017 | 43,859 | 43,572 | → |
| Konak | District | 411,112 | 385,843 | 363,181 | 327,300 | → |
| Menderes | District | 69,515 | 77,706 | 89,777 | 109,356 | → |
| Menemen | District | 128,113 | 142,836 | 170,090 | 207,748 | → |
| Narlıdere | District | 65,714 | 63,743 | 66,269 | 62,148 | → |
| Ödemiş | District | 129,210 | 129,295 | 132,241 | 132,650 | → |
| Seferihisar | District | 28,603 | 33,588 | 40,785 | 58,570 | → |
| Selçuk | District | 34,479 | 34,979 | 35,991 | 38,467 | → |
| Tire | District | 78,176 | 80,381 | 83,829 | 87,935 | → |
| Torbalı | District | 124,581 | 144,293 | 172,359 | 214,059 | → |
| Urla | District | 50,609 | 56,751 | 64,895 | 77,599 | → |
| Türkiye [Turkey] | Republic | 72,561,312 | 76,667,864 | 80,810,525 | 85,372,377 |
Source: State Institute of Statistics, Republic of Türkiye.
Explanation: Area figures of districts are computed by using geospatial data.
Further information about the population structure:
| Gender (E 2023) | |
|---|---|
| Males | 2,221,180 |
| Females | 2,258,345 |
| Age Groups (E 2023) | |
|---|---|
| 0-14 years | 777,792 |
| 15-64 years | 3,127,877 |
| 65+ years | 573,856 |
| Age Distribution (E 2023) | |
|---|---|
| 90+ years | 14,873 |
| 80-89 years | 89,758 |
| 70-79 years | 259,698 |
| 60-69 years | 461,765 |
| 50-59 years | 590,171 |
| 40-49 years | 717,097 |
| 30-39 years | 665,921 |
| 20-29 years | 619,434 |
| 10-19 years | 561,030 |
| 0-9 years | 499,778 |