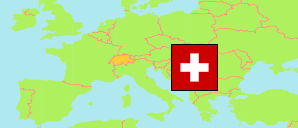
Luzern
Canton in Switzerland
Contents: Subdivision
The population development in Luzern as well as related information and services (Wikipedia, Google, images).
| Name | Status | Population Census 1980-12-02 | Population Census 1990-12-04 | Population Census 2000-12-05 | Population Estimate 2010-12-31 | Population Estimate 2020-12-31 | Population Estimate 2024-12-31 | |
|---|---|---|---|---|---|---|---|---|
| Luzern [Lucerne] | Canton | 296,159 | 326,268 | 350,504 | 377,610 | 416,347 | 437,944 | |
| Wahlkreis Entlebuch | District | 20,658 | 21,249 | 22,468 | 22,802 | 23,303 | 24,375 | → |
| Wahlkreis Hochdorf | District | 47,714 | 54,888 | 60,753 | 66,081 | 74,143 | 77,308 | → |
| Wahlkreis Luzern-Land [Lucerne Country] | District | 66,554 | 78,537 | 86,603 | 95,438 | 104,751 | 111,832 | → |
| Wahlkreis Luzern-Stadt [Lucerne City] | District | 78,274 | 76,466 | 75,425 | 77,491 | 82,620 | 86,234 | → |
| Wahlkreis Sursee | District | 43,717 | 51,967 | 58,448 | 66,624 | 76,451 | 80,164 | → |
| Wahlkreis Willisau | District | 39,242 | 43,161 | 46,807 | 49,174 | 55,079 | 58,031 | → |
| Schweiz (Suisse, Svizzera, Svizra, Helvetia) [Switzerland] | Confederation | 6,365,960 | 6,873,687 | 7,288,010 | 7,870,134 | 8,670,300 | 9,051,029 |
Source: Swiss Federal Statistical Office.
Explanation: The population figures for 2024 are final.
Further information about the population structure:
| Gender (E 2024) | |
|---|---|
| Males | 218,841 |
| Females | 219,103 |
| Age Groups (E 2024) | |
|---|---|
| 0-17 years | 79,760 |
| 18-64 years | 275,012 |
| 65+ years | 83,172 |
| Age Distribution (E 2024) | |
|---|---|
| 90+ years | 4,299 |
| 80-89 years | 19,615 |
| 70-79 years | 35,489 |
| 60-69 years | 53,453 |
| 50-59 years | 60,437 |
| 40-49 years | 59,899 |
| 30-39 years | 63,922 |
| 20-29 years | 52,283 |
| 10-19 years | 44,401 |
| 0-9 years | 44,146 |
| Citizenship (E 2024) | |
|---|---|
| Switzerland | 343,673 |
| Germany | 16,163 |
| France | 861 |
| Italy | 9,509 |
| Portugal | 7,968 |
| EU (others) | 19,545 |
| Europe (non-EU countries) | 23,512 |
| Africa | 4,771 |
| Asia | 9,189 |
| Other Citizenship | 2,667 |
| Country of Birth (E 2024) | |
|---|---|
| Switzerland | 328,874 |
| Other country | 109,070 |