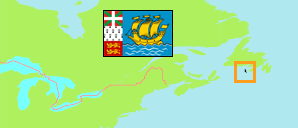
Territory
The population development of Saint-Pierre and Miquelon according to census results and latest official estimates.
| Name | Abbr. | Area A (km²) | Population Census (C) 1982-03-09 | Population Census (C) 1990-03-15 | Population Census (C) 1999-03-08 | Population Census (C) 2006-01-01 | Population Estimate (E) 2015-01-01 | Population Estimate (E) 2021-01-01 | |||
|---|---|---|---|---|---|---|---|---|---|---|---|
| Saint-Pierre and Miquelon | SPM | 242 | 6,041 | 6,277 | 6,316 | 6,125 | 6,021 | 5,873 |
Contents: Communes
The population of the two communes of Saint-Pierre and Miquelon according to census results and latest official estimates.
| Name | Population Census (C) 1982-03-09 | Population Census (C) 1990-03-15 | Population Census (C) 1999-03-08 | Population Census (C) 2006-01-01 | Population Estimate (E) 2015-01-01 | Population Estimate (E) 2021-01-01 | Area | |
|---|---|---|---|---|---|---|---|---|
| Miquelon-Langlade | 626 | 697 | 698 | 616 | 606 | 591 | 21600 | |
| Saint-Pierre | 5,415 | 5,580 | 5,618 | 5,509 | 5,415 | 5,282 | 2600 |
- Institut National de la Statistique et des Etudes Economiques, France (web).
Population Structure
Further information about the population structure.
| Gender (E 2020) | |
|---|---|
| Males | 2,919 |
| Females | 3,006 |
| Age Groups (E 2020) | |
|---|---|
| 0-15 years | 1,006 |
| 18-59 years | 3,838 |
| 60+ years | 1,081 |
| Age Pyramid (E 2020) | |
|---|---|
| 90+ years | 44 |
| 80-89 years | 280 |
| 70-79 years | 455 |
| 60-69 years | 707 |
| 50-59 years | 1,083 |
| 40-49 years | 870 |
| 30-39 years | 715 |
| 20-29 years | 463 |
| 10-19 years | 715 |
| 0-9 years | 593 |
