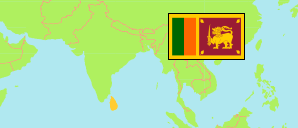
Mannar
District in Sri Lanka
Contents: Population
The population development of Mannar as well as related information and services (Wikipedia, Google, images).
| Name | Status | Population Census 1981-03-17 | Population Census 2001-07-17 | Population Census 2012-03-20 | Population Estimate 2021-07-01 | |
|---|---|---|---|---|---|---|
| Mannar | District | 106,235 | 151,577 | 99,570 | 114,000 | |
| Sri Lanka | Republic | 14,846,750 | 18,797,257 | 20,359,439 | 22,156,000 |
Source: Department of Census and Statistics, Sri Lanka (web).
Explanation: The 2021 estimates are provisional.
Further information about the population structure:
| Gender (E 2021) | |
|---|---|
| Males | 57,000 |
| Females | 57,000 |
| Urbanization (C 2012) | |
|---|---|
| Rural | 75,153 |
| Urban | 24,417 |
| Age Groups (C 2012) | |
|---|---|
| 0-14 years | 28,728 |
| 15-64 years | 66,265 |
| 65+ years | 4,577 |
| Age Distribution (C 2012) | |
|---|---|
| 0-9 years | 18,695 |
| 10-19 years | 19,986 |
| 20-29 years | 15,683 |
| 30-39 years | 15,094 |
| 40-49 years | 12,118 |
| 50-59 years | 9,742 |
| 60-69 years | 5,540 |
| 70-79 years | 2,085 |
| 80+ years | 627 |
| Ethnic Group (C 2012) | |
|---|---|
| Sinhalese | 2,305 |
| Tamil | 80,795 |
| Sri Lankan Moor | 16,436 |
| Other ethnic group | 34 |
| Religion (C 2012) | |
|---|---|
| Buddhist | 1,809 |
| Hindu | 24,027 |
| Muslim | 16,512 |
| Christian | 57,205 |
| Other religion | 17 |
| Place of Birth (C 2012) | |
|---|---|
| in the same district | 79,871 |
| elsewhere | 19,699 |