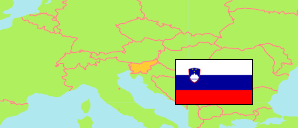
Vitanje
Municipality in Savinjska
Municipality
The population development of Vitanje.
| Name | Status | Population Census 2002-03-31 | Population Census 2011-01-01 | Population Census 2021-01-01 | Population Estimate 2022-01-01 | |
|---|---|---|---|---|---|---|
| Vitanje | Municipality | 2,317 | 2,289 | 2,267 | 2,266 | → |
| Savinjska [Savinja] | Region | 253,574 | 259,726 | 264,428 | 264,206 |
Contents: Settlements
The population development of the settlements in Vitanje.
| Name | Status | Municipality | Population Census 2002-03-31 | Population Census 2011-01-01 | Population Census 2021-01-01 | Population Estimate 2022-01-01 | |
|---|---|---|---|---|---|---|---|
| Brezen | Settlement | Vitanje | 218 | 228 | 199 | 200 | → |
| Hudinja | Settlement | Vitanje | 236 | 212 | 224 | 237 | → |
| Ljubnica | Settlement | Vitanje | 311 | 300 | 304 | 305 | → |
| Paka | Settlement | Vitanje | 252 | 259 | 264 | 260 | → |
| Spodnji Dolič | Settlement | Vitanje | 193 | 190 | 177 | 179 | → |
| Stenica | Settlement | Vitanje | 160 | 150 | 162 | 164 | → |
| Vitanje | Settlement | Vitanje | 863 | 865 | 862 | 846 | → |
Source: Statistical Office of the Republic of Slovenia (web).
Explanation: The 2011 and 2021 population figures are result of a register-based census.