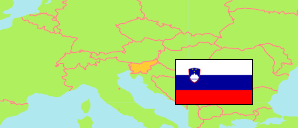
Dravograd
Municipality in Koroška
Municipality
The population development of Dravograd.
| Name | Status | Population Census 2002-03-31 | Population Census 2011-01-01 | Population Census 2021-01-01 | Population Estimate 2022-01-01 | |
|---|---|---|---|---|---|---|
| Dravograd | Municipality | 8,863 | 9,038 | 8,844 | 8,882 | → |
| Koroška [Slovenian Carinthia] | Region | 73,296 | 72,494 | 70,635 | 70,571 |
Contents: Settlements
The population development of the settlements in Dravograd.
| Name | Status | Municipality | Population Census 2002-03-31 | Population Census 2011-01-01 | Population Census 2021-01-01 | Population Estimate 2022-01-01 | |
|---|---|---|---|---|---|---|---|
| Bukovska vas | Settlement | Dravograd | 341 | 371 | 365 | 362 | → |
| Črneče | Settlement | Dravograd | 654 | 665 | 604 | 642 | → |
| Dobrova pri Dravogradu | Settlement | Dravograd | 170 | 155 | 167 | 164 | → |
| Dravograd | Urban Settlement | Dravograd | 3,414 | 3,289 | 3,095 | 3,089 | → |
| Gorče | Settlement | Dravograd | 136 | 138 | 132 | 128 | → |
| Goriški Vrh | Settlement | Dravograd | 201 | 236 | 254 | 248 | → |
| Libeliče | Settlement | Dravograd | 205 | 205 | 203 | 208 | → |
| Libeliška Gora | Settlement | Dravograd | 143 | 160 | 174 | 174 | → |
| Otiški Vrh | Settlement | Dravograd | 879 | 869 | 895 | 900 | → |
| Podklanc | Settlement | Dravograd | 139 | 153 | 141 | 135 | → |
| Selovec | Settlement | Dravograd | 424 | 471 | 500 | 496 | → |
| Šentjanž pri Dravogradu | Settlement | Dravograd | 503 | 543 | 531 | 544 | → |
| Sveti Boštjan | Settlement | Dravograd | 79 | 94 | 105 | 101 | → |
| Sveti Danijel | Settlement | Dravograd | 419 | 482 | 481 | 473 | → |
| Sveti Duh | Settlement | Dravograd | 111 | 100 | 109 | 116 | → |
| Trbonje | Settlement | Dravograd | 239 | 235 | 214 | 220 | → |
| Vič | Settlement | Dravograd | 215 | 241 | 286 | 288 | → |
| Vrata | Settlement | Dravograd | 106 | 107 | 103 | 109 | → |
Source: Statistical Office of the Republic of Slovenia (web).
Explanation: The 2011 and 2021 population figures are result of a register-based census.