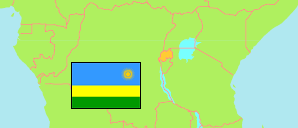
Ouest
Province in Rwanda
Contents: Subdivision
The population development in Ouest as well as related information and services (Wikipedia, Google, images).
| Name | Status | Population Census 2002-08-16 | Population Census 2012-08-15 | Population Census 2022-08-15 | |
|---|---|---|---|---|---|
| Ouest (Intara y'Iburengerazuba) [Western] | Province | 2,043,555 | 2,471,239 | 2,896,484 | |
| Karongi | District | 278,944 | 331,808 | 373,869 | → |
| Ngororero | District | 282,249 | 333,713 | 367,955 | → |
| Nyabihu | District | 268,367 | 294,740 | 319,047 | → |
| Nyamasheke | District | 325,032 | 381,804 | 434,221 | → |
| Rubavu | District | 292,653 | 403,662 | 546,683 | → |
| Rusizi | District | 331,950 | 400,858 | 485,529 | → |
| Rutsiro | District | 264,360 | 324,654 | 369,180 | → |
| Rwanda | Republic | 8,128,553 | 10,515,973 | 13,246,394 |
Source: National Institute of Statistics Rwanda.
Further information about the population structure:
| Gender (C 2022) | |
|---|---|
| Males | 1,384,635 |
| Females | 1,511,849 |
| Age Groups (C 2022) | |
|---|---|
| 0-14 years | 1,143,618 |
| 15-64 years | 1,622,268 |
| 65+ years | 125,908 |
| Age Distribution (C 2022) | |
|---|---|
| 80+ years | 24,811 |
| 70-79 years | 50,404 |
| 60-69 years | 123,147 |
| 50-59 years | 146,452 |
| 40-49 years | 249,819 |
| 30-39 years | 369,529 |
| 20-29 years | 447,152 |
| 10-19 years | 701,184 |
| 0-9 years | 779,296 |
| Urbanization (C 2022) | |
|---|---|
| Rural | 2,256,177 |
| Urban | 640,307 |
| Citizenship (C 2022) | |
|---|---|
| Rwanda | 2,880,813 |
| Foreign Citizenship | 15,671 |
| Literacy (A15+) (C 2022) | |
|---|---|
| yes | 1,319,900 |
| no | 433,000 |