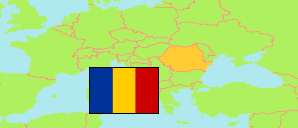
Sud-Est
Development Region in Romania
Contents: Subdivision
The population development in Sud-Est as well as related information and services (Wikipedia, Google, images).
| Name | Status | Population Census 1977-01-05 | Population Census 1992-01-07 | Population Census 2002-03-18 | Population Census 2011-10-20 | Population Census 2021-12-01 | |
|---|---|---|---|---|---|---|---|
| Sud-Est [South East] | Development Region | 2,701,027 | 2,963,177 | 2,848,219 | 2,545,923 | 2,367,987 | |
| Brăila | County | 377,954 | 392,031 | 373,174 | 321,212 | 281,452 | → |
| Buzău | County | 508,424 | 516,961 | 496,214 | 451,069 | 404,979 | → |
| Constanța | County | 608,817 | 748,769 | 715,151 | 684,082 | 655,997 | → |
| Galați | County | 581,561 | 641,011 | 619,556 | 536,167 | 496,892 | → |
| Tulcea | County | 254,531 | 270,997 | 256,492 | 213,083 | 193,355 | → |
| Vrancea | County | 369,740 | 393,408 | 387,632 | 340,310 | 335,312 | → |
| România [Romania] | Sovereign State | 21,559,910 | 22,810,035 | 21,680,974 | 20,121,641 | 19,053,815 |
Source: Romania National Institute of Statistics (web).
Further information about the population structure:
| Gender (C 2021) | |
|---|---|
| Males | 1,151,096 |
| Females | 1,216,891 |
| Age Groups (C 2021) | |
|---|---|
| 0-14 years | 369,964 |
| 15-64 years | 1,506,111 |
| 65+ years | 491,912 |
| Age Distribution (C 2021) | |
|---|---|
| 80+ years | 112,107 |
| 70-79 years | 209,012 |
| 60-69 years | 332,334 |
| 50-59 years | 343,205 |
| 40-49 years | 362,707 |
| 30-39 years | 286,887 |
| 20-29 years | 220,184 |
| 10-19 years | 268,989 |
| 0-9 years | 232,562 |
| Urbanization (C 2021) | |
|---|---|
| Rural | 1,148,988 |
| Urban | 1,218,999 |
| Citizenship (C 2021) | |
|---|---|
| Romanian | 2,363,763 |
| Foreign Citizenship | 4,224 |
| Place of Birth (C 2021) | |
|---|---|
| Same place | 1,514,326 |
| Other place in same county | 389,682 |
| Other county in Romania | 419,233 |
| European Union | 28,007 |
| Other country | 16,739 |