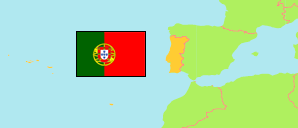
Termas de São Vicente
Parish in Porto District
Contents: Population
The population development of Termas de São Vicente as well as related information and services (Wikipedia, Google, images).
| Name | Status | Population Census 2001-03-12 | Population Census 2011-03-21 | Population Census 2021-03-22 | |
|---|---|---|---|---|---|
| Termas de São Vicente | Parish | 4,905 | 5,028 | 4,758 | |
| Porto | District | 1,781,836 | 1,817,175 | 1,785,405 |
Source: Instituto Nacional de Estatística Portugal (web).
Further information about the population structure:
| Gender (C 2021) | |
|---|---|
| Males | 2,300 |
| Females | 2,458 |
| Age Groups (C 2021) | |
|---|---|
| 0-14 years | 626 |
| 15-64 years | 3,276 |
| 65+ years | 856 |
| Age Distribution (C 2021) | |
|---|---|
| 80+ years | 198 |
| 70-79 years | 367 |
| 60-69 years | 627 |
| 50-59 years | 791 |
| 40-49 years | 705 |
| 30-39 years | 527 |
| 20-29 years | 618 |
| 10-19 years | 559 |
| 0-9 years | 366 |
| Citizenship (C 2021) | |
|---|---|
| Portugal | 4,726 |
| EU | 1 |
| Europe (other) | 2 |
| Africa | 10 |
| America | 17 |
| Asia & Oceania | 2 |
| Country of Birth (C 2021) | |
|---|---|
| Portugal | 4,642 |
| EU | 35 |
| Europe (other) | 31 |
| Africa | 21 |
| America | 25 |
| Asia & Oceania | 4 |