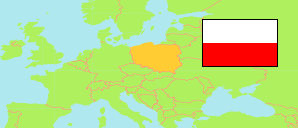
Powiat zamojski
County in Lublin Voivodeship
Contents: Subdivision
The population development in Powiat zamojski as well as related information and services (Wikipedia, Google, images).
| Name | Status | Population Census 2002-05-20 | Population Census 2011-03-31 | Population Census 2021-03-31 | |
|---|---|---|---|---|---|
| Powiat zamojski [Zamość County] | County | 111,560 | 109,858 | 102,890 | |
| Adamów | Rural Commune | 5,248 | 4,935 | 4,520 | → |
| Grabowiec | Rural Commune | 4,892 | 4,435 | 3,714 | → |
| Komarów-Osada | Rural Commune | 5,657 | 5,380 | 4,605 | → |
| Krasnobród | Urban-Rural Commune | 7,346 | 7,268 | 6,822 | → |
| Łabunie | Rural Commune | 6,256 | 6,370 | 6,006 | → |
| Miączyn | Rural Commune | 6,460 | 6,214 | 5,307 | → |
| Nielisz | Rural Commune | 6,224 | 5,833 | 5,241 | → |
| Radecznica | Rural Commune | 6,708 | 6,096 | 5,235 | → |
| Sitno | Rural Commune | 6,725 | 6,854 | 6,580 | → |
| Skierbieszów | Rural Commune | 5,779 | 5,525 | 4,862 | → |
| Stary Zamość | Rural Commune | 5,568 | 5,444 | 4,975 | → |
| Sułów | Rural Commune | 5,376 | 4,877 | 4,229 | → |
| Szczebrzeszyn | Urban-Rural Commune | 12,327 | 11,854 | 10,860 | → |
| Zamość (gm.w.) | Rural Commune | 19,699 | 21,675 | 23,601 | → |
| Zwierzyniec | Urban-Rural Commune | 7,295 | 7,098 | 6,333 | → |
| Lubelskie [Lublin] | Voivodeship | 2,199,054 | 2,175,700 | 2,052,340 |
Source: Główny Urząd Statystyczny, Warszawa (web).
Further information about the population structure:
| Gender (C 2021) | |
|---|---|
| Males | 50,785 |
| Females | 52,105 |
| Age Groups (C 2021) | |
|---|---|
| 0-17 years | 18,216 |
| 18-64 years | 64,794 |
| 65+ years | 19,880 |
| Age Distribution (C 2021) | |
|---|---|
| 90+ years | 1,029 |
| 80-89 years | 4,436 |
| 70-79 years | 8,040 |
| 60-69 years | 13,688 |
| 50-59 years | 13,764 |
| 40-49 years | 14,711 |
| 30-39 years | 14,793 |
| 20-29 years | 12,014 |
| 10-19 years | 11,051 |
| 0-9 years | 9,364 |
| Urbanization (C 2021) | |
|---|---|
| Rural | 92,110 |
| Urban | 10,780 |