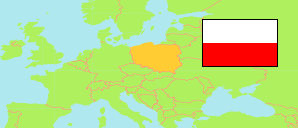
Podkarpackie
Voivodeship in Poland
Contents: Subdivision
The population development in Podkarpackie as well as related information and services (Wikipedia, Google, images).
| Name | Status | Population Census 2002-05-20 | Population Census 2011-03-31 | Population Census 2021-03-31 | Population Estimate 2023-12-31 | |
|---|---|---|---|---|---|---|
| Podkarpackie [Subcarpathia] | Voivodeship | 2,095,515 | 2,127,285 | 2,093,360 | 2,071,676 | |
| Powiat bieszczadzki [Bieszczady County] | County | 22,326 | 22,465 | 21,023 | 20,601 | → |
| Powiat brzozowski [Brzozów County] | County | 65,533 | 66,539 | 64,190 | 63,203 | → |
| Powiat dębicki [Dębica County] | County | 131,775 | 134,876 | 133,742 | 132,615 | → |
| Powiat jarosławski [Jarosław County] | County | 121,821 | 122,780 | 117,558 | 115,865 | → |
| Powiat jasielski [Jasło County] | County | 115,245 | 115,734 | 110,770 | 108,819 | → |
| Powiat kolbuszowski [Kolbuszowa County] | County | 61,162 | 62,833 | 61,820 | 61,160 | → |
| Powiat krośnieński [Krosno County] | County | 108,880 | 111,681 | 110,042 | 108,659 | → |
| Powiat Krosno | Urban County | 48,372 | 47,471 | 45,057 | 44,060 | → |
| Powiat łańcucki [Łańcut County] | County | 77,143 | 79,373 | 80,994 | 80,844 | → |
| Powiat leski [Lesko County] | County | 26,526 | 26,924 | 25,896 | 25,397 | → |
| Powiat leżajski [Leżajsk County] | County | 69,134 | 70,152 | 67,767 | 66,698 | → |
| Powiat lubaczowski [Lubaczów County] | County | 57,664 | 57,761 | 53,758 | 52,565 | → |
| Powiat mielecki [Mielec County] | County | 132,935 | 135,980 | 134,164 | 132,983 | → |
| Powiat niżański [Nisko County] | County | 67,257 | 67,812 | 64,825 | 63,733 | → |
| Powiat przemyski [Przemyśl County] | County | 71,166 | 73,629 | 71,929 | 71,131 | → |
| Powiat Przemyśl | Urban County | 68,095 | 65,000 | 58,408 | 56,050 | → |
| Powiat przeworski [Przeworsk County] | County | 78,911 | 79,402 | 76,621 | 75,739 | → |
| Powiat ropczycko-sędziszowski [Ropczyce-Sędziszów County] | County | 70,793 | 73,001 | 74,006 | 74,027 | → |
| Powiat Rzeszów | Urban County | ... | 183,191 | 195,871 | 197,268 | → |
| Powiat rzeszowski [Rzeszów County] | County | ... | 159,199 | 173,189 | 175,777 | → |
| Powiat sanocki [Sanok County] | County | 94,382 | 96,249 | 91,510 | 89,743 | → |
| Powiat stalowowolski [Stalowa Wola County] | County | 110,405 | 109,760 | 103,301 | 100,891 | → |
| Powiat strzyżowski [Strzyżów County] | County | 61,940 | 62,360 | 60,189 | 59,201 | → |
| Powiat Tarnobrzeg | Urban County | 50,287 | 48,821 | 44,901 | 43,712 | → |
| Powiat tarnobrzeski [Tarnobrzeg County] | County | 54,078 | 54,292 | 51,829 | 50,935 | → |
| Polska [Poland] | Republic | 38,230,080 | 38,511,824 | 38,036,118 | 37,636,508 |
Source: Główny Urząd Statystyczny, Warszawa.
Further information about the population structure:
| Gender (E 2023) | |
|---|---|
| Males | 1,013,946 |
| Females | 1,057,730 |
| Age Groups (E 2023) | |
|---|---|
| 0-17 years | 383,861 |
| 18-64 years | 1,294,431 |
| 65+ years | 393,384 |
| Age Distribution (E 2023) | |
|---|---|
| 80+ years | 88,817 |
| 70-79 years | 175,164 |
| 60-69 years | 261,375 |
| 50-59 years | 262,535 |
| 40-49 years | 326,368 |
| 30-39 years | 306,191 |
| 20-29 years | 225,508 |
| 10-19 years | 224,339 |
| 0-9 years | 201,379 |
| Urbanization (E 2023) | |
|---|---|
| Rural | 1,222,515 |
| Urban | 849,161 |
| Citizenship (C 2021) | |
|---|---|
| Poland | 2,090,752 |
| Other Citizenship | 2,585 |
| Country of Birth (C 2021) | |
|---|---|
| Poland | 2,044,722 |
| Other country | 47,800 |