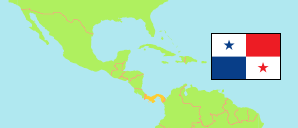
Coclé
Province in Panama
Contents: Subdivision
The population in Coclé as well as related information and services (Wikipedia, Google, images).
| Name | Status | Population Census 2023-01-08 | |
|---|---|---|---|
| Coclé | Province | 268,264 | |
| Aguadulce | Township | 9,576 | → |
| Antón | Township | 10,711 | → |
| Barrios Unidos | Township | 9,991 | → |
| Boca de Tucué | Township | 2,090 | → |
| Caballero | Township | 4,136 | → |
| Cabuya | Township | 2,092 | → |
| Cañaveral | Township | 9,324 | → |
| Candelario Ovalle | Township | 3,615 | → |
| Capellanía | Township | 2,967 | → |
| Chiguirí Arriba | Township | 7,185 | → |
| Coclé | Township | 5,811 | → |
| El Caño | Township | 3,440 | → |
| El Chirú | Township | 3,889 | → |
| El Coco | Township | 11,064 | → |
| El Copé | Township | 1,503 | → |
| El Cristo | Township | 3,085 | → |
| El Harino | Township | 5,752 | → |
| El Hato de San Juan de Dios | Township | 1,384 | → |
| El Palmar | Township | 1,296 | → |
| El Picacho | Township | 346 | → |
| El Potrero | Township | 3,450 | → |
| El Retiro | Township | 2,937 | → |
| El Roble | Township | 4,830 | → |
| El Valle (El Valle de Antón) | Township | 7,595 | → |
| General Victoriano Lorenzo | Township | 8,496 | → |
| Guzmán | Township | 978 | → |
| Juan Díaz | Township | 3,516 | → |
| La Pava | Township | 1,683 | → |
| La Pintada | Township | 4,497 | → |
| Las Huacas | Township | 1,581 | → |
| Las Lomas | Township | 2,350 | → |
| Las Minas | Township | 2,662 | → |
| Llano Grande | Township | 4,114 | → |
| Llano Norte | Township | 4,822 | → |
| Natá | Township | 6,317 | → |
| Olá | Township | 1,472 | → |
| Pajonal | Township | 7,678 | → |
| Penonomé | Township | 25,836 | → |
| Piedras Gordas | Township | 4,713 | → |
| Pocrí | Township | 8,194 | → |
| Pueblos Unidos | Township | 4,055 | → |
| Riecito | Township | 1,315 | → |
| Río Grande | Township | 3,505 | → |
| Río Hato | Township | 15,950 | → |
| Río Indio | Township | 4,026 | → |
| San Juan de Dios | Township | 5,538 | → |
| San Miguel | Township | 2,038 | → |
| Santa Rita | Township | 2,830 | → |
| Toabré | Township | 7,440 | → |
| Toza | Township | 2,437 | → |
| Tulú | Township | 2,241 | → |
| Villarreal | Township | 2,021 | → |
| Virgen del Carmen | Township | 7,890 | → |
| Panamá | Republic | 4,202,572 |
Source: Instituto Nacional de Estadística y Censo, Panamá.
Explanation: The tabulated census results are not adjusted for underenumeration. The 2023 total population includes 137,792 persons taken from administrative registers; they are not included in the province and township figures. Area figures of townships are computed using geospatial data.
Further information about the population structure:
| Gender (C 2023) | |
|---|---|
| Males | 136,127 |
| Females | 132,137 |
| Age Groups (C 2023) | |
|---|---|
| 0-14 years | 63,688 |
| 15-64 years | 173,030 |
| 65+ years | 31,546 |
| Age Distribution (C 2023) | |
|---|---|
| 90+ years | 1,598 |
| 80-89 years | 6,848 |
| 70-79 years | 13,728 |
| 60-69 years | 21,070 |
| 50-59 years | 29,047 |
| 40-49 years | 31,710 |
| 30-39 years | 35,819 |
| 20-29 years | 42,689 |
| 10-19 years | 44,605 |
| 0-9 years | 41,150 |
| Urbanization (C 2023) | |
|---|---|
| Rural | 170,973 |
| Urban | 97,291 |
| Ethnic Group (C 2023) | |
|---|---|
| Ngäbe | 2,600 |
| Guna | 569 |
| Other Indigenous | 4,793 |
| African, Not Indigenous | 96,681 |
| Not African, Not Indigenous | 163,618 |