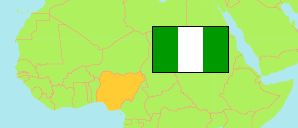
Kogi
State in Nigeria
Contents: Subdivision
The population development in Kogi as well as related information and services (Wikipedia, Google, images).
| Name | Status | Population Census 1991-11-26 | Population Census 2006-03-21 | Population Projection 2022-03-21 | |
|---|---|---|---|---|---|
| Kogi | State | 2,147,756 | 3,314,043 | 4,466,800 | |
| Adavi | Local Government Area | 157,092 | 217,219 | 292,800 | → |
| Ajaokuta | Local Government Area | 97,904 | 122,432 | 165,000 | → |
| Ankpa | Local Government Area | ... | 266,176 | 358,800 | → |
| Bassa | Local Government Area | 88,496 | 139,687 | 188,300 | → |
| Dekina | Local Government Area | 177,513 | 260,968 | 351,700 | → |
| Ibaji | Local Government Area | ... | 127,572 | 171,900 | → |
| Idah | Local Government Area | ... | 79,755 | 107,500 | → |
| Igalamela-Odolu | Local Government Area | ... | 147,048 | 198,200 | → |
| Ijumu | Local Government Area | 66,603 | 118,593 | 159,800 | → |
| Kabba/Bunu | Local Government Area | ... | 144,579 | 194,900 | → |
| Kogi | Local Government Area | 82,483 | 115,100 | 155,100 | → |
| Lokoja | Local Government Area | ... | 196,643 | 265,000 | → |
| Mopa-Muro | Local Government Area | ... | 43,760 | 59,000 | → |
| Ofu | Local Government Area | 108,095 | 191,480 | 258,100 | → |
| Ogori/Magongo | Local Government Area | ... | 39,807 | 53,700 | → |
| Okehi | Local Government Area | 146,264 | 223,574 | 301,300 | → |
| Okene | Local Government Area | ... | 325,623 | 438,900 | → |
| Olamaboro | Local Government Area | 104,705 | 158,490 | 213,600 | → |
| Omala | Local Government Area | ... | 107,968 | 145,500 | → |
| Yagba East | Local Government Area | 88,780 | 147,641 | 199,000 | → |
| Yagba West | Local Government Area | 76,936 | 139,928 | 188,600 | → |
| Nigeria | Federal Republic | 88,992,220 | 140,431,790 | 216,783,400 |
Source: National Population Commission of Nigeria (web), National Bureau of Statistics (web).
Explanation: The population projection assumes the same rate of growth for all LGAs within a state. The undercount of the 1991 census is estimated to be about 25 million. All population figures for Nigeria show high error rates; census results are disputed. Area figures are computed using geospatial data.
Further information about the population structure:
| Gender (C 2006) | |
|---|---|
| Males | 1,672,903 |
| Females | 1,641,140 |
| Age Groups (C 2006) | |
|---|---|
| 0-14 years | 1,507,045 |
| 15-64 years | 1,715,165 |
| 65+ years | 91,833 |
| Age Distribution (C 2006) | |
|---|---|
| 0-9 years | 1,122,948 |
| 10-19 years | 728,506 |
| 20-29 years | 566,764 |
| 30-39 years | 375,041 |
| 40-49 years | 243,113 |
| 50-59 years | 131,528 |
| 60-69 years | 79,342 |
| 70-79 years | 37,194 |
| 80+ years | 29,607 |