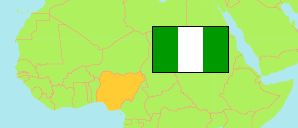
Katsina
State in Nigeria
Contents: Subdivision
The population development in Katsina as well as related information and services (Wikipedia, Google, images).
| Name | Status | Population Census 1991-11-26 | Population Census 2006-03-21 | Population Projection 2022-03-21 | |
|---|---|---|---|---|---|
| Katsina | State | 3,753,133 | 5,801,584 | 10,368,500 | |
| Bakori | Local Government Area | 132,936 | 149,516 | 267,200 | → |
| Batagarawa | Local Government Area | 84,864 | 189,059 | 337,900 | → |
| Batsari | Local Government Area | 143,620 | 207,874 | 371,500 | → |
| Baure | Local Government Area | ... | 202,941 | 362,700 | → |
| Bindawa | Local Government Area | 120,636 | 151,002 | 269,900 | → |
| Charanchi | Local Government Area | ... | 136,989 | 244,800 | → |
| Dandume | Local Government Area | ... | 145,323 | 259,700 | → |
| Danja | Local Government Area | 98,524 | 125,481 | 224,300 | → |
| Dan Musa | Local Government Area | ... | 113,190 | 202,300 | → |
| Daura | Local Government Area | 156,872 | 224,884 | 401,900 | → |
| Dutsi | Local Government Area | ... | 120,902 | 216,100 | → |
| Dutsin-Ma | Local Government Area | 115,790 | 169,829 | 303,500 | → |
| Faskari | Local Government Area | ... | 194,400 | 347,400 | → |
| Funtua | Local Government Area | ... | 225,156 | 402,400 | → |
| Ingawa | Local Government Area | 114,935 | 169,148 | 302,300 | → |
| Jibia | Local Government Area | 124,731 | 167,435 | 299,200 | → |
| Kafur | Local Government Area | 136,813 | 209,360 | 374,200 | → |
| Kaita | Local Government Area | 101,878 | 182,405 | 326,000 | → |
| Kankara | Local Government Area | 152,748 | 243,259 | 434,700 | → |
| Kankia | Local Government Area | ... | 151,395 | 270,600 | → |
| Katsina | Local Government Area | 223,644 | 318,132 | 568,600 | → |
| Kurfi | Local Government Area | 74,020 | 116,700 | 208,600 | → |
| Kusada | Local Government Area | ... | 98,348 | 175,800 | → |
| Mai'adua | Local Government Area | 137,976 | 201,800 | 360,700 | → |
| Malumfashi | Local Government Area | 158,338 | 182,891 | 326,900 | → |
| Mani | Local Government Area | 121,889 | 176,301 | 315,100 | → |
| Mashi | Local Government Area | ... | 171,070 | 305,700 | → |
| Matazu | Local Government Area | 74,030 | 113,814 | 203,400 | → |
| Musawa | Local Government Area | 79,184 | 170,006 | 303,800 | → |
| Rimi | Local Government Area | ... | 154,092 | 275,400 | → |
| Sabuwa | Local Government Area | ... | 140,679 | 251,400 | → |
| Safana | Local Government Area | ... | 185,207 | 331,000 | → |
| Sandamu | Local Government Area | ... | 136,944 | 244,700 | → |
| Zango | Local Government Area | ... | 156,052 | 278,900 | → |
| Nigeria | Federal Republic | 88,992,220 | 140,431,790 | 216,783,400 |
Source: National Population Commission of Nigeria (web), National Bureau of Statistics (web).
Explanation: The population projection assumes the same rate of growth for all LGAs within a state. The undercount of the 1991 census is estimated to be about 25 million. All population figures for Nigeria show high error rates; census results are disputed. Area figures are computed using geospatial data.
Further information about the population structure:
| Gender (C 2006) | |
|---|---|
| Males | 2,948,279 |
| Females | 2,853,305 |
| Age Groups (C 2006) | |
|---|---|
| 0-14 years | 2,815,858 |
| 15-64 years | 2,825,677 |
| 65+ years | 160,049 |
| Age Distribution (C 2006) | |
|---|---|
| 0-9 years | 2,157,576 |
| 10-19 years | 1,223,441 |
| 20-29 years | 937,321 |
| 30-39 years | 627,153 |
| 40-49 years | 389,515 |
| 50-59 years | 216,260 |
| 60-69 years | 119,706 |
| 70-79 years | 71,083 |
| 80+ years | 59,529 |