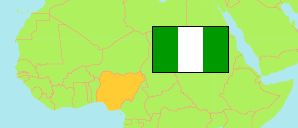
Kano
State in Nigeria
Contents: Subdivision
The population development in Kano as well as related information and services (Wikipedia, Google, images).
| Name | Status | Population Census 1991-11-26 | Population Census 2006-03-21 | Population Projection 2022-03-21 | |
|---|---|---|---|---|---|
| Kano | State | 5,810,470 | 9,401,288 | 15,462,200 | |
| Ajingi | Local Government Area | ... | 172,610 | 283,900 | → |
| Albasu | Local Government Area | 116,603 | 187,639 | 308,600 | → |
| Bagwai | Local Government Area | 106,645 | 161,533 | 265,700 | → |
| Bebeji | Local Government Area | 118,833 | 191,916 | 315,600 | → |
| Bichi | Local Government Area | 182,674 | 278,309 | 457,700 | → |
| Bunkure | Local Government Area | 122,856 | 174,467 | 286,900 | → |
| Dala | Local Government Area | ... | 418,759 | 688,700 | → |
| Dambatta | Local Government Area | ... | 210,474 | 346,200 | → |
| Dawakin Kudu | Local Government Area | 163,668 | 225,497 | 370,900 | → |
| Dawakin Tofa | Local Government Area | 156,443 | 246,197 | 404,900 | → |
| Doguwa | Local Government Area | 83,365 | 150,645 | 247,800 | → |
| Fagge | Local Government Area | ... | 200,095 | 329,100 | → |
| Gabasawa | Local Government Area | 152,899 | 211,204 | 347,400 | → |
| Garko | Local Government Area | ... | 161,966 | 266,400 | → |
| Garum Mallam | Local Government Area | ... | 118,622 | 195,100 | → |
| Gaya | Local Government Area | ... | 207,419 | 341,100 | → |
| Gezawa | Local Government Area | 154,629 | 282,328 | 464,300 | → |
| Gwale | Local Government Area | ... | 357,827 | 588,500 | → |
| Gwarzo | Local Government Area | 118,778 | 183,624 | 302,000 | → |
| Kabo | Local Government Area | 90,158 | 153,158 | 251,900 | → |
| Kano Municipal | Local Government Area | ... | 371,243 | 610,600 | → |
| Karaye | Local Government Area | ... | 144,045 | 236,900 | → |
| Kibiya | Local Government Area | ... | 138,618 | 228,000 | → |
| Kiru | Local Government Area | 156,584 | 267,168 | 439,400 | → |
| Kumbotso | Local Government Area | 166,558 | 294,391 | 484,200 | → |
| Kunchi | Local Government Area | ... | 110,170 | 181,200 | → |
| Kura | Local Government Area | ... | 143,094 | 235,300 | → |
| Madobi | Local Government Area | 78,924 | 137,685 | 226,400 | → |
| Makoda | Local Government Area | ... | 220,094 | 362,000 | → |
| Minjibir | Local Government Area | 139,750 | 219,611 | 361,200 | → |
| Nasarawa | Local Government Area | ... | 596,411 | 980,900 | → |
| Rano | Local Government Area | ... | 148,276 | 243,900 | → |
| Rimin Gado | Local Government Area | 60,622 | 103,371 | 170,000 | → |
| Rogo | Local Government Area | ... | 227,607 | 374,300 | → |
| Shanono | Local Government Area | 84,861 | 139,128 | 228,800 | → |
| Sumaila | Local Government Area | 164,242 | 250,379 | 411,800 | → |
| Takai | Local Government Area | 130,007 | 202,639 | 333,300 | → |
| Tarauni | Local Government Area | ... | 221,844 | 364,900 | → |
| Tofa | Local Government Area | 64,796 | 98,603 | 162,200 | → |
| Tsanyawa | Local Government Area | ... | 157,730 | 259,400 | → |
| Tudun Wada | Local Government Area | 141,288 | 228,658 | 376,100 | → |
| Ungogo | Local Government Area | 168,373 | 365,737 | 601,500 | → |
| Warawa | Local Government Area | 81,666 | 131,858 | 216,900 | → |
| Wudil | Local Government Area | ... | 188,639 | 310,300 | → |
| Nigeria | Federal Republic | 88,992,220 | 140,431,790 | 216,783,400 |
Source: National Population Commission of Nigeria (web), National Bureau of Statistics (web).
Explanation: The population projection assumes the same rate of growth for all LGAs within a state. The undercount of the 1991 census is estimated to be about 25 million. All population figures for Nigeria show high error rates; census results are disputed. Area figures are computed using geospatial data.
Further information about the population structure:
| Gender (C 2006) | |
|---|---|
| Males | 4,947,952 |
| Females | 4,453,336 |
| Age Groups (C 2006) | |
|---|---|
| 0-14 years | 4,422,452 |
| 15-64 years | 4,699,126 |
| 65+ years | 279,710 |
| Age Distribution (C 2006) | |
|---|---|
| 0-9 years | 3,322,489 |
| 10-19 years | 2,079,592 |
| 20-29 years | 1,570,195 |
| 30-39 years | 1,015,902 |
| 40-49 years | 629,731 |
| 50-59 years | 356,584 |
| 60-69 years | 194,580 |
| 70-79 years | 120,312 |
| 80+ years | 111,903 |