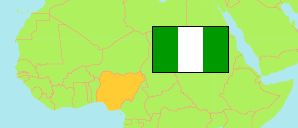
Imo
State in Nigeria
Contents: Subdivision
The population development in Imo as well as related information and services (Wikipedia, Google, images).
| Name | Status | Population Census 1991-11-26 | Population Census 2006-03-21 | Population Projection 2022-03-21 | |
|---|---|---|---|---|---|
| Imo | State | 2,485,635 | 3,927,563 | 5,459,300 | |
| Abo-Mbaise | Local Government Area | 115,360 | 194,779 | 270,700 | → |
| Ahiazu-Mbaise | Local Government Area | 96,170 | 170,824 | 237,400 | → |
| Ehime-Mbano | Local Government Area | 97,145 | 130,575 | 181,500 | → |
| Ezinihitte | Local Government Area | 92,462 | 168,767 | 234,600 | → |
| Ideato North | Local Government Area | 118,519 | 156,161 | 217,100 | → |
| Ideato South | Local Government Area | 79,236 | 159,654 | 221,900 | → |
| Ihitte/Uboma | Local Government Area | 69,009 | 119,419 | 166,000 | → |
| Ikeduru | Local Government Area | 108,367 | 149,737 | 208,100 | → |
| Isiala-Mbano | Local Government Area | 106,170 | 197,921 | 275,100 | → |
| Isu | Local Government Area | ... | 164,328 | 228,400 | → |
| Mbaitoli | Local Government Area | 148,531 | 237,474 | 330,100 | → |
| Ngor-Okpala | Local Government Area | 135,711 | 157,858 | 219,400 | → |
| Njaba | Local Government Area | ... | 143,485 | 199,400 | → |
| Nkwerre | Local Government Area | ... | 80,270 | 111,600 | → |
| Nwangele | Local Government Area | ... | 127,691 | 177,500 | → |
| Obowo | Local Government Area | 64,277 | 117,432 | 163,200 | → |
| Oguta | Local Government Area | ... | 142,340 | 197,900 | → |
| Ohaji/Egbema | Local Government Area | 119,116 | 182,891 | 254,200 | → |
| Okigwe | Local Government Area | ... | 132,701 | 184,500 | → |
| Orlu | Local Government Area | 117,343 | 142,792 | 198,500 | → |
| Orsu | Local Government Area | 87,521 | 120,224 | 167,100 | → |
| Oru East | Local Government Area | ... | 111,743 | 155,300 | → |
| Oru West | Local Government Area | ... | 115,704 | 160,800 | → |
| Owerri Municipal | Local Government Area | ... | 125,337 | 174,200 | → |
| Owerri North | Local Government Area | ... | 176,334 | 245,100 | → |
| Owerri West | Local Government Area | ... | 101,754 | 141,400 | → |
| Unuimo | Local Government Area | ... | 99,368 | 138,100 | → |
| Nigeria | Federal Republic | 88,992,220 | 140,431,790 | 216,783,400 |
Source: National Population Commission of Nigeria (web), National Bureau of Statistics (web).
Explanation: The population projection assumes the same rate of growth for all LGAs within a state. The undercount of the 1991 census is estimated to be about 25 million. All population figures for Nigeria show high error rates; census results are disputed. Area figures are computed using geospatial data.
Further information about the population structure:
| Gender (C 2006) | |
|---|---|
| Males | 1,976,471 |
| Females | 1,951,092 |
| Age Groups (C 2006) | |
|---|---|
| 0-14 years | 1,415,929 |
| 15-64 years | 2,341,565 |
| 65+ years | 170,069 |
| Age Distribution (C 2006) | |
|---|---|
| 0-9 years | 942,457 |
| 10-19 years | 939,913 |
| 20-29 years | 730,624 |
| 30-39 years | 473,193 |
| 40-49 years | 362,409 |
| 50-59 years | 223,726 |
| 60-69 years | 134,392 |
| 70-79 years | 72,937 |
| 80+ years | 47,912 |