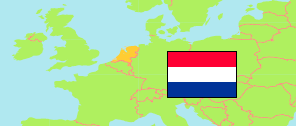
Zeeland
Province in Netherlands
Contents: Subdivision
The population development in Zeeland as well as related information and services (Wikipedia, Google, images).
| Name | Status | Population Census 2001-01-01 | Population Estimate 2011-01-01 | Population Estimate 2016-01-01 | Population Estimate 2021-01-01 | Population Estimate 2026-01-01 | |
|---|---|---|---|---|---|---|---|
| Zeeland [Zealand] | Province | 374,912 | 381,530 | 381,252 | 385,400 | 394,514 | |
| Borsele | Municipality | 22,007 | 22,707 | 22,612 | 22,818 | 23,185 | → |
| Goes | Municipality | 35,953 | 36,665 | 37,207 | 38,594 | 40,399 | → |
| Hulst | Municipality | 27,662 | 27,719 | 27,372 | 27,575 | 27,375 | → |
| Kapelle | Municipality | 11,442 | 12,365 | 12,639 | 12,882 | 13,156 | → |
| Middelburg (Z.) | Municipality | 45,426 | 48,030 | 47,873 | 48,964 | 50,438 | → |
| Noord-Beveland | Municipality | 6,971 | 7,474 | 7,421 | 7,581 | 8,071 | → |
| Reimerswaal | Municipality | 20,726 | 21,614 | 22,265 | 22,896 | 23,393 | → |
| Schouwen-Duiveland | Municipality | 34,193 | 34,203 | 33,735 | 34,065 | 34,398 | → |
| Sluis | Municipality | 24,594 | 23,979 | 23,639 | 23,166 | 23,191 | → |
| Terneuzen | Municipality | 55,370 | 54,823 | 54,657 | 54,463 | 55,942 | → |
| Tholen | Municipality | 23,763 | 25,489 | 25,421 | 26,085 | 27,032 | → |
| Veere | Municipality | 22,031 | 21,926 | 21,960 | 21,953 | 22,041 | → |
| Vlissingen | Municipality | 44,774 | 44,536 | 44,451 | 44,358 | 45,893 | → |
| Nederland [The Netherlands] | Country | 15,985,538 | 16,655,799 | 16,979,120 | 17,475,415 | 18,131,238 |
Source: Statistics Netherlands.
Explanation: Provinces and municipalities in the boundaries of 1 January 2026. Municipalities of the Caribbean Netherlands are not included. The land area is tabulated. The 2026 population figures are preliminary.
Further information about the population structure:
| Gender (E 2025) | |
|---|---|
| Males | 195,678 |
| Females | 197,291 |
| Age Groups (E 2025) | |
|---|---|
| 0-17 years | 70,262 |
| 18-64 years | 223,606 |
| 65+ years | 99,101 |
| Age Distribution (E 2025) | |
|---|---|
| 90+ years | 4,227 |
| 80-89 years | 22,074 |
| 70-79 years | 46,554 |
| 60-69 years | 54,758 |
| 50-59 years | 56,478 |
| 40-49 years | 44,288 |
| 30-39 years | 44,570 |
| 20-29 years | 41,634 |
| 10-19 years | 41,410 |
| 0-9 years | 36,976 |
| Urbanization (E 2025) | |
|---|---|
| Highly urbanized | 24,060 |
| Strongly urbanized | 69,940 |
| Moderately urbanized | 48,210 |
| Lowly urbanized | 102,250 |
| Rural | 147,180 |
| Citizenhip (E 2025) | |
|---|---|
| Netherlands | 357,729 |
| European Union | 23,220 |
| Europe (Rest) | 4,369 |
| Other Citizenship | 7,196 |
| Birth Country (E 2025) | |
|---|---|
| Netherlands | 334,612 |
| Other country | 58,357 |