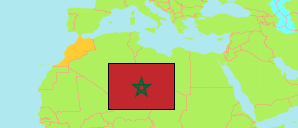
Chichaoua
Province in Morocco
Contents: Population
The population development of Chichaoua as well as related information and services (Wikipedia, Google, images).
| Name | Status | Native | Population Census 1994-09-02 | Population Census 2004-09-02 | Population Census 2014-09-01 | Population Projection 2023-07-01 | |
|---|---|---|---|---|---|---|---|
| Chichaoua | Province | شيشاوة | 311,800 | 339,818 | 369,955 | 403,120 | |
| Al-Maghrib [Morocco] | Kingdom | المغرب | 25,821,571 | 29,475,763 | 33,337,529 | 36,403,782 |
Source: Haut Commissariat au Plan, Royaume du Maroc.
Explanation: Some population changes between 2004 and 2014 are due to boundary changes.
Further information about the population structure:
| Gender (C 2014) | |
|---|---|
| Males | 184,472 |
| Females | 185,022 |
| Age Groups (C 2014) | |
|---|---|
| 0-14 years | 121,896 |
| 15-64 years | 223,542 |
| 65+ years | 24,055 |
| Age Distribution (C 2014) | |
|---|---|
| 70+ years | 16,496 |
| 60-69 years | 19,723 |
| 50-59 years | 29,780 |
| 40-49 years | 37,193 |
| 30-39 years | 47,404 |
| 20-29 years | 59,685 |
| 10-19 years | 76,512 |
| 0-9 years | 82,700 |
| Urbanization (C 2014) | |
|---|---|
| Rural | 307,276 |
| Urban | 62,218 |
| Citizenship (C 2014) | |
|---|---|
| Morocco | 369,889 |
| Foreign Citizenship | 66 |
| Literacy (A10+) (C 2014) | |
|---|---|
| yes | 224,595 |
| no | 144,899 |