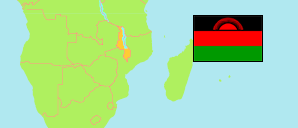
Nsanje
District in Malawi
Contents: Population
The population development of Nsanje as well as related information and services (Wikipedia, Google, images).
| Name | Status | Population Census 1977-09-20 | Population Census 1987-09-01 | Population Census 1998-09-01 | Population Census 2008-06-08 | Population Census 2018-09-03 | Population Projection 2023-09-03 | |
|---|---|---|---|---|---|---|---|---|
| Nsanje | District | 108,758 | 204,374 | 194,924 | 241,107 | 299,168 | 326,874 | |
| Malawi | Republic | 5,547,460 | 7,988,507 | 9,933,868 | 13,029,498 | 17,563,749 | 19,809,511 |
Source: National Statistical Office of Malawi.
Explanation: Population figures until 1998 are de facto, later figures are de jure.
Further information about the population structure:
| Gender (P 2023) | |
|---|---|
| Males | 155,446 |
| Females | 171,428 |
| Age Groups (P 2023) | |
|---|---|
| 0-14 years | 143,796 |
| 15-64 years | 169,536 |
| 65+ years | 13,541 |
| Age Distribution (P 2023) | |
|---|---|
| 0-9 years | 104,202 |
| 10-19 years | 76,395 |
| 20-29 years | 54,458 |
| 30-39 years | 33,686 |
| 40-49 years | 24,295 |
| 50-59 years | 14,941 |
| 60-69 years | 9,413 |
| 70-79 years | 6,261 |
| 80+ years | 3,222 |
| Urbanization (C 2018) | |
|---|---|
| Rural | 272,324 |
| Urban | 26,844 |
| Citizenship (C 2018) | |
|---|---|
| Malawi | 298,566 |
| Foreign Citizenship | 602 |
| Country of Birth (C 2018) | |
|---|---|
| Malawi | 296,710 |
| Other Country | 2,458 |
| Religion (C 2018) | |
|---|---|
| Christian | 263,335 |
| Muslim | 5,825 |
| Traditional | 827 |
| Other religion | 19,745 |
| No religion | 9,436 |
| Literacy (A5+) (C 2018) | |
|---|---|
| yes | 140,605 |
| no | 111,611 |
| Tribe (C 2018) | |
|---|---|
| Chewa | 2,830 |
| Tumbuka | 509 |
| Lomwe | 21,744 |
| Yao | 2,191 |
| Ngoni | 1,488 |
| Sena | 250,855 |
| Mang'anja | 14,978 |
| Other Tribe | 3,971 |