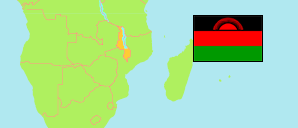
Kasungu
District in Malawi
Contents: Population
The population development of Kasungu as well as related information and services (Wikipedia, Google, images).
| Name | Status | Population Census 1977-09-20 | Population Census 1987-09-01 | Population Census 1998-09-01 | Population Census 2008-06-08 | Population Census 2018-09-03 | Population Projection 2023-09-03 | |
|---|---|---|---|---|---|---|---|---|
| Kasungu | District | 194,436 | 323,453 | 480,659 | 623,592 | 842,953 | 950,234 | |
| Malawi | Republic | 5,547,460 | 7,988,507 | 9,933,868 | 13,029,498 | 17,563,749 | 19,809,511 |
Source: National Statistical Office of Malawi.
Explanation: Population figures until 1998 are de facto, later figures are de jure.
Further information about the population structure:
| Gender (P 2023) | |
|---|---|
| Males | 469,764 |
| Females | 480,470 |
| Age Groups (P 2023) | |
|---|---|
| 0-14 years | 393,033 |
| 15-64 years | 528,407 |
| 65+ years | 28,791 |
| Age Distribution (P 2023) | |
|---|---|
| 0-9 years | 269,041 |
| 10-19 years | 232,736 |
| 20-29 years | 164,413 |
| 30-39 years | 114,180 |
| 40-49 years | 76,415 |
| 50-59 years | 48,891 |
| 60-69 years | 26,017 |
| 70-79 years | 12,704 |
| 80+ years | 5,834 |
| Urbanization (C 2018) | |
|---|---|
| Rural | 726,235 |
| Urban | 116,718 |
| Citizenship (C 2018) | |
|---|---|
| Malawi | 841,333 |
| Foreign Citizenship | 1,620 |
| Country of Birth (C 2018) | |
|---|---|
| Malawi | 838,590 |
| Other Country | 4,363 |
| Religion (C 2018) | |
|---|---|
| Christian | 730,493 |
| Muslim | 18,769 |
| Traditional | 2,632 |
| Other religion | 79,174 |
| No religion | 11,885 |
| Literacy (A5+) (C 2018) | |
|---|---|
| yes | 499,278 |
| no | 222,262 |
| Tribe (C 2018) | |
|---|---|
| Chewa | 657,285 |
| Tumbuka | 133,141 |
| Lomwe | 13,051 |
| Yao | 15,073 |
| Ngoni | 15,852 |
| Sena | 1,131 |
| Mang'anja | 1,151 |
| Other Tribe | 4,649 |