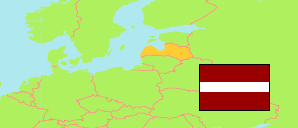
Pierīga
Statistical Region in Latvia
Contents: Subdivision
The population development in Pierīga as well as related information and services (Wikipedia, Google, images).
| Name | Status | Population Estimate 2000-01-01 | Population Estimate 2011-01-01 | Population Estimate 2021-01-01 | |
|---|---|---|---|---|---|
| Pierīga | Statistical Region | 361,894 | 371,427 | 378,982 | |
| Ādažu novads | Municipality | 12,070 | 16,738 | 21,134 | → |
| Jūrmala | City | 55,814 | 50,841 | 50,248 | → |
| Ķekavas novads | Municipality | 21,438 | 27,391 | 30,077 | → |
| Limbažu novads | Municipality | 38,461 | 31,420 | 28,546 | → |
| Mārupes novads | Municipality | 15,833 | 25,352 | 32,824 | → |
| Ogres novads | Municipality | 63,014 | 61,123 | 57,617 | → |
| Olaines novads | Municipality | 18,618 | 20,116 | 19,705 | → |
| Ropažu novads | Municipality | 21,375 | 28,343 | 31,697 | → |
| Salaspils novads | Municipality | 21,045 | 22,392 | 22,868 | → |
| Saulkrastu novads | Municipality | 7,861 | 8,147 | 9,230 | → |
| Siguldas novads | Municipality | 30,834 | 30,040 | 30,625 | → |
| Tukuma novads | Municipality | 55,531 | 49,524 | 44,411 | → |
| Latvija [Latvia] | Republic | 2,377,062 | 2,070,371 | 1,893,223 |
Source: Central Statistical Bureau of Latvia (web).
Explanation: The presented division follows the municipal reform that comes into effect on 1 July 2021. The population figures are partly provisional. The 2000 and 2011 figures are based on census results and classified as "experimental statistics" by CSB.
Further information about the population structure:
| Gender (E 2021) | |
|---|---|
| Males | 179,855 |
| Females | 199,127 |
| Age Groups (E 2021) | |
|---|---|
| 0-14 years | 71,106 |
| 15-64 years | 239,339 |
| 65+ years | 68,537 |
| Citizenship (E 2021) | |
|---|---|
| Latvian | 341,311 |
| Foreign Citizenship | 37,671 |
| Country of Birth (E 2021) | |
|---|---|
| Latvia | 342,112 |
| EU 27 | 3,285 |
| Other country | 33,585 |
| Ethnic Group (E 2021) | |
|---|---|
| Latvians | 273,370 |
| Russians | 68,059 |
| Other / Unknown Group | 37,553 |