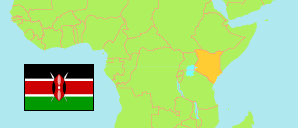
Central
Former Province in Kenya
Contents: Subdivision
The population development in Central as well as related information and services (Wikipedia, Google, images).
| Name | Status | Population Census 1979-08-24 | Population Census 1989-08-24 | Population Census 1999-08-24 | Population Census 2009-08-24 | Population Census 2019-08-24 | Population Projection 2023-07-01 | |
|---|---|---|---|---|---|---|---|---|
| Central | Former Province | 2,345,833 | 3,116,703 | 3,724,159 | 4,383,743 | 5,482,239 | 5,949,219 | |
| Kiambu | County | 686,290 | 914,412 | 1,389,723 | 1,623,282 | 2,417,735 | 2,652,880 | → |
| Kirinyaga | County | 291,431 | 391,516 | 457,105 | 528,054 | 610,411 | 653,112 | → |
| Murang'a | County | 648,333 | 858,063 | 736,273 | 942,581 | 1,056,640 | 1,112,288 | → |
| Nyandarua | County | 233,302 | 345,420 | 479,902 | 596,268 | 638,289 | 695,531 | → |
| Nyeri | County | 486,477 | 607,292 | 661,156 | 693,558 | 759,164 | 835,408 | → |
| Kenya | Republic | 15,327,061 | 21,443,636 | 28,686,607 | 38,610,097 | 47,564,296 | 51,525,602 |
Source: Kenya National Bureau of Statistics.
Further information about the population structure:
| Gender (P 2023) | |
|---|---|
| Males | 2,933,061 |
| Females | 3,016,158 |
| Age Groups (P 2023) | |
|---|---|
| 0-14 years | 1,862,109 |
| 15-64 years | 3,743,709 |
| 65+ years | 343,403 |
| Age Distribution (P 2023) | |
|---|---|
| 80+ years | 103,522 |
| 70-79 years | 146,587 |
| 60-69 years | 225,185 |
| 50-59 years | 406,933 |
| 40-49 years | 653,585 |
| 30-39 years | 890,673 |
| 20-29 years | 1,101,810 |
| 10-19 years | 1,153,429 |
| 0-9 years | 1,267,497 |
| Urbanization (C 2019) | |
|---|---|
| Rural | 3,304,013 |
| Urban | 2,178,226 |
| Religion (C 2019) | |
|---|---|
| Catholic s | 1,347,605 |
| Protestants | 2,017,957 |
| Evangelicals | 1,195,336 |
| Other Christians | 728,847 |
| Muslims | 32,846 |
| Hindus | 1,743 |
| Traditional religion | 5,644 |
| Other religion | 43,877 |
| No Religion | 68,670 |