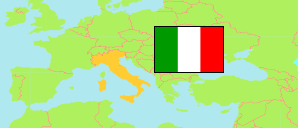
Italy: Rome City
Contents: Roma
City
2,617,175 Population [2011] – census
2,749,031 Population [2021] – census
1,285km² Area
2,139/km² Density [2021]
Contents: Boroughs
The population of the boroughs of Rome City.
| Name | Status | Population Census 2011-10-09 | Population Census 2021-12-31 | |
|---|---|---|---|---|
| Municipio I | Borough | 164,027 | 162,598 | → |
| Municipio II | Borough | 154,223 | 160,972 | → |
| Municipio III | Borough | 191,707 | 201,184 | → |
| Municipio IV | Borough | 167,822 | 166,655 | → |
| Municipio V | Borough | 226,320 | 236,891 | → |
| Municipio VI | Borough | 226,338 | 234,013 | → |
| Municipio VII | Borough | 290,416 | 305,988 | → |
| Municipio VIII | Borough | 124,392 | 124,721 | → |
| Municipio IX | Borough | 163,180 | 178,429 | → |
| Municipio X | Borough | 209,435 | 222,557 | → |
| Municipio XI | Borough | 140,457 | 148,370 | → |
| Municipio XII | Borough | 130,426 | 137,552 | → |
| Municipio XIII | Borough | 123,244 | 128,052 | → |
| Municipio XIV | Borough | 170,944 | 186,414 | → |
| Municipio XV | Borough | 134,244 | 154,635 | → |
| Roma [Rome] | City | 2,617,175 | 2,749,031 |
Source: Istituto Nazionale di Statistica Italia.
Explanation: Population figures for 2021 are result of a sampling survey combined with an evaluation of registers. Area figures are derived from geospatial data.
Further information about the population structure:
| Gender (C 2021) | |
|---|---|
| Males | 1,305,497 |
| Females | 1,443,534 |
| Age Groups (C 2021) | |
|---|---|
| 0-14 years | 350,091 |
| 15-64 years | 1,758,161 |
| 65+ years | 640,779 |
| Age Distribution (C 2021) | |
|---|---|
| 70+ years | 484,963 |
| 60-69 years | 342,815 |
| 50-59 years | 465,613 |
| 40-49 years | 412,470 |
| 30-39 years | 308,629 |
| 20-29 years | 256,123 |
| 10-19 years | 260,030 |
| 0-9 years | 218,388 |
| Citizenship (C 2021) | |
|---|---|
| Italy | 2,410,483 |
| European Union | 101,449 |
| Other Citizenship | 237,099 |