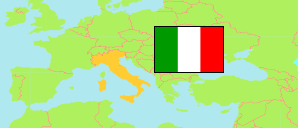
Lazio
Region in Italy
Contents: Subdivision
The population development in Lazio as well as related information and services (Wikipedia, Google, images).
| Name | Status | Population Census 1981-10-25 | Population Census 1991-10-20 | Population Census 2001-10-21 | Population Census 2011-10-09 | Population Estimate 2022-01-01 | Population Estimate 2024-01-01 | |
|---|---|---|---|---|---|---|---|---|
| Lazio [Latium] | Region | 5,001,684 | 5,140,371 | 5,112,413 | 5,502,886 | 5,714,882 | 5,720,272 | |
| Frosinone | Province | 460,395 | 479,559 | 484,566 | 492,661 | 470,689 | 464,988 | → |
| Latina | Province | 434,086 | 476,282 | 491,230 | 544,732 | 567,439 | 566,485 | → |
| Rieti | Province | 142,794 | 144,942 | 147,410 | 155,164 | 151,143 | 150,320 | → |
| Roma [Rome] | Metropolitan City | 3,695,961 | 3,761,067 | 3,700,424 | 3,997,465 | 4,216,874 | 4,230,292 | → |
| Viterbo | Province | 268,448 | 278,521 | 288,783 | 312,864 | 308,737 | 308,187 | → |
| Italia [Italy] | Republic | 56,556,911 | 56,778,031 | 56,995,744 | 59,433,744 | 59,030,133 | 58,989,749 |
Source: Istituto Nazionale di Statistica Italia.
Explanation: The tabulated population estimates are result of a sampling survey combined with an evaluation of registers. The 2024 figures are preliminary.
Further information about the population structure:
| Gender (E 2024) | |
|---|---|
| Males | 2,772,254 |
| Females | 2,948,018 |
| Age Groups (E 2024) | |
|---|---|
| 0-17 years | 869,415 |
| 18-64 years | 3,509,418 |
| 65+ years | 1,341,439 |
| Age Distribution (E 2024) | |
|---|---|
| 90+ years | 77,717 |
| 80-89 years | 346,332 |
| 70-79 years | 567,789 |
| 60-69 years | 768,239 |
| 50-59 years | 964,782 |
| 40-49 years | 819,961 |
| 30-39 years | 642,177 |
| 20-29 years | 553,482 |
| 10-19 years | 552,462 |
| 0-9 years | 427,331 |
| Citizenship (E 2024) | |
|---|---|
| Italy | 5,072,513 |
| Foreign Citizenship | 647,759 |