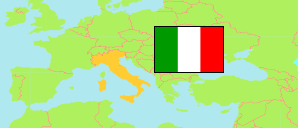
Piemonte
Region in Italy
Contents: Subdivision
The population development in Piemonte as well as related information and services (Wikipedia, Google, images).
| Name | Status | Population Census 1981-10-25 | Population Census 1991-10-20 | Population Census 2001-10-21 | Population Census 2011-10-09 | Population Census 2021-12-31 | Population Estimate 2025-01-01 | |
|---|---|---|---|---|---|---|---|---|
| Piemonte [Piedmont] | Region | 4,479,031 | 4,302,565 | 4,214,677 | 4,363,916 | 4,256,350 | 4,255,702 | |
| Alessandria | Province | 466,102 | 438,245 | 418,231 | 427,229 | 407,264 | 407,029 | → |
| Asti | Province | 215,382 | 208,332 | 208,339 | 217,573 | 208,286 | 207,310 | → |
| Biella | Province | 202,135 | 191,291 | 187,249 | 182,192 | 170,027 | 168,257 | → |
| Cuneo | Province | 548,452 | 547,234 | 556,330 | 586,378 | 580,155 | 581,676 | → |
| Novara | Province | 337,271 | 334,614 | 343,040 | 365,559 | 361,916 | 364,478 | → |
| Torino [Turin] | Metropolitan City | 2,345,771 | 2,236,765 | 2,165,619 | 2,247,780 | 2,208,370 | 2,207,873 | → |
| Verbano-Cusio-Ossola | Province | 170,096 | 162,215 | 159,040 | 160,264 | 154,249 | 153,201 | → |
| Vercelli | Province | 193,822 | 183,869 | 176,829 | 176,941 | 166,083 | 165,878 | → |
| Italia [Italy] | Republic | 56,556,911 | 56,778,031 | 56,995,744 | 59,433,744 | 59,030,133 | 58,934,177 |
Source: Istituto Nazionale di Statistica Italia.
Explanation: The 2025 figures are preliminary.
Further information about the population structure:
| Gender (E 2025) | |
|---|---|
| Males | 2,083,188 |
| Females | 2,172,514 |
| Age Groups (E 2025) | |
|---|---|
| 0-17 years | 596,434 |
| 18-64 years | 2,516,475 |
| 65+ years | 1,142,793 |
| Age Distribution (E 2025) | |
|---|---|
| 90+ years | 72,311 |
| 80-89 years | 307,627 |
| 70-79 years | 483,914 |
| 60-69 years | 603,071 |
| 50-59 years | 696,853 |
| 40-49 years | 539,269 |
| 30-39 years | 454,949 |
| 20-29 years | 421,482 |
| 10-19 years | 384,810 |
| 0-9 years | 291,416 |
| Citizenship (E 2025) | |
|---|---|
| Italy | 3,806,840 |
| Foreign Citizenship | 448,862 |