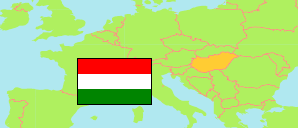
Szentendre
District in Pest
District
The population development of Szentendre.
| Name | Status | Population Census 1980-01-01 | Population Census 1990-01-01 | Population Census 2001-02-01 | Population Census 2011-10-01 | Population Census 2022-10-01 | |
|---|---|---|---|---|---|---|---|
| Szentendre | District | 54,253 | 56,726 | 67,489 | 77,802 | 88,937 | → |
| Pest | County | 973,830 | 949,842 | 1,083,877 | 1,217,476 | 1,333,533 |
Contents: Towns and Villages
The population development of the towns and villages in Szentendre.
| Name | Status | District | Population Census 1980-01-01 | Population Census 1990-01-01 | Population Census 2001-02-01 | Population Census 2011-10-01 | Population Census 2022-10-01 | |
|---|---|---|---|---|---|---|---|---|
| Budakalász | Town | Szentendre | 7,817 | 7,967 | 9,476 | 10,619 | 12,362 | → |
| Csobánka | Village | Szentendre | 2,033 | 2,040 | 2,840 | 3,153 | 3,562 | → |
| Dunabogdány | Village | Szentendre | 2,839 | 2,723 | 2,934 | 3,037 | 3,327 | → |
| Kisoroszi | Village | Szentendre | 758 | 598 | 749 | 927 | 946 | → |
| Leányfalu | Large Village | Szentendre | 1,556 | 1,603 | 2,412 | 3,385 | 4,099 | → |
| Pilisszentkereszt | Village | Szentendre | 2,104 | 2,054 | 2,170 | 2,259 | 2,194 | → |
| Pilisszentlászló | Village | Szentendre | 940 | 835 | 958 | 1,223 | 1,286 | → |
| Pócsmegyer | Village | Szentendre | 759 | 654 | 1,113 | 1,859 | 2,766 | → |
| Pomáz | Town | Szentendre | 11,706 | 12,435 | 14,404 | 16,622 | 18,879 | → |
| Szentendre | Town | Szentendre | 16,901 | 19,351 | 22,747 | 25,310 | 28,524 | → |
| Szigetmonostor | Village | Szentendre | 1,357 | 1,281 | 1,567 | 2,202 | 2,972 | → |
| Tahitótfalu | Village | Szentendre | 3,455 | 3,404 | 4,462 | 5,488 | 6,226 | → |
| Visegrád | Town | Szentendre | 2,028 | 1,781 | 1,657 | 1,718 | 1,794 | → |
Source: Hungarian Central Statistical Office.
Explanation: 2022 census results are final.