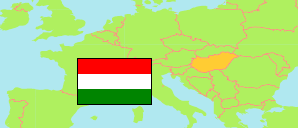
Bátonyterenye
District in Nógrád
District
The population development of Bátonyterenye.
| Name | Status | Population Census 1980-01-01 | Population Census 1990-01-01 | Population Census 2001-02-01 | Population Census 2011-10-01 | Population Census 2022-10-01 | |
|---|---|---|---|---|---|---|---|
| Bátonyterenye | District | 27,328 | 25,577 | 24,433 | 21,789 | 18,878 | → |
| Nógrád | County | 240,251 | 227,137 | 220,261 | 202,427 | 182,459 |
Contents: Towns and Villages
The population development of the towns and villages in Bátonyterenye.
| Name | Status | District | Population Census 1980-01-01 | Population Census 1990-01-01 | Population Census 2001-02-01 | Population Census 2011-10-01 | Population Census 2022-10-01 | |
|---|---|---|---|---|---|---|---|---|
| Bátonyterenye | Town | Bátonyterenye | 14,395 | 14,603 | 14,354 | 12,841 | 11,110 | → |
| Dorogháza | Village | Bátonyterenye | 1,614 | 1,344 | 1,293 | 1,129 | 966 | → |
| Mátramindszent | Village | Bátonyterenye | 1,165 | 1,039 | 949 | 852 | 697 | → |
| Mátranovák | Village | Bátonyterenye | 2,622 | 2,354 | 2,026 | 1,794 | 1,515 | → |
| Mátraterenye | Village | Bátonyterenye | 2,588 | 2,162 | 2,024 | 1,857 | 1,659 | → |
| Mátraverebély | Village | Bátonyterenye | 2,863 | 2,313 | 2,220 | 1,971 | 1,768 | → |
| Nemti | Village | Bátonyterenye | 1,091 | 917 | 822 | 760 | 662 | → |
| Szuha | Village | Bátonyterenye | 990 | 845 | 745 | 585 | 501 | → |
Source: Hungarian Central Statistical Office.
Explanation: 2022 census results are final.