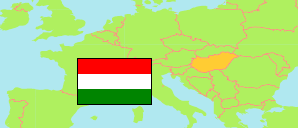
Pannonhalma
District in Győr-Moson-Sopron
District
The population development of Pannonhalma.
| Name | Status | Population Census 1980-01-01 | Population Census 1990-01-01 | Population Census 2001-02-01 | Population Census 2011-10-01 | Population Census 2022-10-01 | |
|---|---|---|---|---|---|---|---|
| Pannonhalma | District | 17,000 | 15,277 | 15,665 | 15,227 | 15,317 | → |
| Győr-Moson-Sopron | County | 437,857 | 432,126 | 438,773 | 447,985 | 465,945 |
Contents: Towns and Villages
The population development of the towns and villages in Pannonhalma.
| Name | Status | District | Population Census 1980-01-01 | Population Census 1990-01-01 | Population Census 2001-02-01 | Population Census 2011-10-01 | Population Census 2022-10-01 | |
|---|---|---|---|---|---|---|---|---|
| Bakonygyirót | Village | Pannonhalma | 298 | 217 | 183 | 148 | 144 | → |
| Bakonypéterd | Village | Pannonhalma | 363 | 261 | 272 | 262 | 287 | → |
| Bakonyszentlászló | Village | Pannonhalma | 1,890 | 1,950 | 2,035 | 1,825 | 1,604 | → |
| Écs | Village | Pannonhalma | 1,714 | 1,585 | 1,744 | 1,829 | 2,208 | → |
| Fenyőfő | Village | Pannonhalma | 217 | 167 | 159 | 106 | 98 | → |
| Győrasszonyfa | Village | Pannonhalma | 630 | 560 | 503 | 496 | 507 | → |
| Lázi | Village | Pannonhalma | 722 | 546 | 634 | 575 | 514 | → |
| Nyalka | Village | Pannonhalma | 524 | 444 | 421 | 445 | 514 | → |
| Pannonhalma | Town | Pannonhalma | 4,096 | 3,722 | 3,907 | 3,691 | 3,477 | → |
| Pázmándfalu | Village | Pannonhalma | 1,144 | 937 | 903 | 966 | 1,118 | → |
| Ravazd | Village | Pannonhalma | 1,250 | 1,149 | 1,178 | 1,189 | 1,203 | → |
| Románd | Village | Pannonhalma | 432 | 351 | 322 | 305 | 319 | → |
| Sikátor | Village | Pannonhalma | 471 | 346 | 340 | 311 | 323 | → |
| Táp | Village | Pannonhalma | 899 | 792 | 709 | 720 | 708 | → |
| Tápszentmiklós | Village | Pannonhalma | 968 | 920 | 948 | 942 | 888 | → |
| Tarjánpuszta | Village | Pannonhalma | 384 | 388 | 379 | 392 | 401 | → |
| Veszprémvarsány | Village | Pannonhalma | 998 | 942 | 1,028 | 1,025 | 1,004 | → |
Source: Hungarian Central Statistical Office.
Explanation: 2022 census results are final.