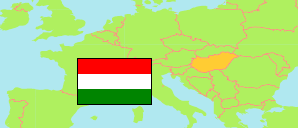
Kistelek
District in Csongrád-Csanád
District
The population development of Kistelek.
| Name | Status | Population Census 1980-01-01 | Population Census 1990-01-01 | Population Census 2001-02-01 | Population Census 2011-10-01 | Population Census 2022-10-01 | |
|---|---|---|---|---|---|---|---|
| Kistelek | District | 22,088 | 20,077 | 19,467 | 18,185 | 17,160 | → |
| Csongrád-Csanád | County | 456,300 | 438,842 | 433,344 | 417,456 | 391,184 |
Contents: Towns and Villages
The population development of the towns and villages in Kistelek.
| Name | Status | District | Population Census 1980-01-01 | Population Census 1990-01-01 | Population Census 2001-02-01 | Population Census 2011-10-01 | Population Census 2022-10-01 | |
|---|---|---|---|---|---|---|---|---|
| Baks | Village | Kistelek | 2,568 | 2,406 | 2,366 | 2,005 | 1,905 | → |
| Balástya | Village | Kistelek | 4,374 | 3,732 | 3,663 | 3,498 | 3,147 | → |
| Csengele | Village | Kistelek | 2,584 | 2,233 | 2,037 | 1,947 | 1,801 | → |
| Kistelek | Town | Kistelek | 8,313 | 7,786 | 7,491 | 7,103 | 6,995 | → |
| Ópusztaszer | Village | Kistelek | 2,294 | 2,184 | 2,290 | 2,174 | 1,964 | → |
| Pusztaszer | Village | Kistelek | 1,955 | 1,736 | 1,620 | 1,458 | 1,348 | → |
Source: Hungarian Central Statistical Office.
Explanation: 2022 census results are final.